Plot
? |
Symb
? |
Source
* |
Average ? |
Thresholds ? |
N_
data |
QC1
parameter |
Data
downloads |
Remarks |
| method |
value |
unit |
method |
value |
| 1 |
• | QC1DB |
MEDIAN |
2.96 |
none |
none | |
77 |
resid_rms |
this |
last_yr |
all
|
Dispersion of wavelength solution, from MOS WAVE data, 580.0nm, 1x1, Plate 1, 7+1FIB Mode, Fibre 1, RED UPPER CCD |
| 2 |
• | QC1DB |
MEDIAN |
1.98 |
none |
none | |
78 |
resid_rms |
this |
last_yr |
all
|
same, for fibre 2 |
| 3 |
• | QC1DB |
MEDIAN |
1.97 |
none |
none | |
78 |
resid_rms |
this |
last_yr |
all
|
same, for fibre 3 |
| 4 |
• | QC1DB |
MEDIAN |
1.97 |
none |
VAL | 1.0,3.1 |
78 |
resid_rms |
this |
last_yr |
all
|
same, for fibre 4This plot is not scored; |
|
| 5 |
• | QC1DB |
MEDIAN |
2.02 |
none |
VAL | 1.0,3.1 |
78 |
resid_rms |
this |
last_yr |
all
|
same, for fibre 5This plot is scored; |
| 6 |
• | QC1DB |
MEDIAN |
1.98 |
none |
none | |
78 |
resid_rms |
this |
last_yr |
all
|
same, for fibre 6 |
| 7 |
• | QC1DB |
MEDIAN |
1.96 |
none |
none | |
78 |
resid_rms |
this |
last_yr |
all
|
same, for fibre 7 |
| 8 |
• | QC1DB |
MEDIAN |
2.02 |
none |
none | |
78 |
resid_rms |
this |
last_yr |
all
|
same, for fibre 8 |
| |
|
*Data sources: QC1DB: QC1 database; LOCAL: local data source
|
Plot 1
scores: not implemented
| | data source: | uves_fib_wave
(QC1 database) |
| dataset: | resid_rms | • |
| median: | 2.96 | none |
| thresholds: | none | |
| N_data plotted: | 77 |
| [click plot for closeup] |
Plot 2
scores: not implemented
| | data source: | uves_fib_wave
(QC1 database) |
| dataset: | resid_rms | • |
| median: | 1.98 | none |
| thresholds: | none | |
| N_data plotted: | 78 |
| [click plot for closeup] |
Plot 3
scores: not implemented
| | data source: | uves_fib_wave
(QC1 database) |
| dataset: | resid_rms | • |
| median: | 1.97 | none |
| thresholds: | none | |
| N_data plotted: | 78 |
| [click plot for closeup] |
Plot 4
scores: not implemented
| | data source: | uves_fib_wave_scoreQC
(QC1 database) |
| dataset: | resid_rms | • |
| median: | 1.97 | none |
| fixed thresholds: | 1.0...3.1 | none |
| N_data plotted: | 78 |
| [click plot for closeup] |
Plot 5
scores:  9| 9|
| | data source: | uves_fib_wave_fib5
(QC1 database) |
| dataset: | resid_rms | • |
| median: | 2.02 | none |
| fixed thresholds: | 1.0...3.1 | none |
| N_data plotted: | 78 |
| [click plot for closeup] |
Plot 6
scores: not implemented
| | data source: | uves_fib_wave
(QC1 database) |
| dataset: | resid_rms | • |
| median: | 1.98 | none |
| thresholds: | none | |
| N_data plotted: | 78 |
| [click plot for closeup] |
Plot 7
scores: not implemented
| | data source: | uves_fib_wave
(QC1 database) |
| dataset: | resid_rms | • |
| median: | 1.96 | none |
| thresholds: | none | |
| N_data plotted: | 78 |
| [click plot for closeup] |
Plot 8
scores: not implemented
| | data source: | uves_fib_wave
(QC1 database) |
| dataset: | resid_rms | • |
| median: | 2.02 | none |
| thresholds: | none | |
| N_data plotted: | 78 |
| [click plot for closeup] |
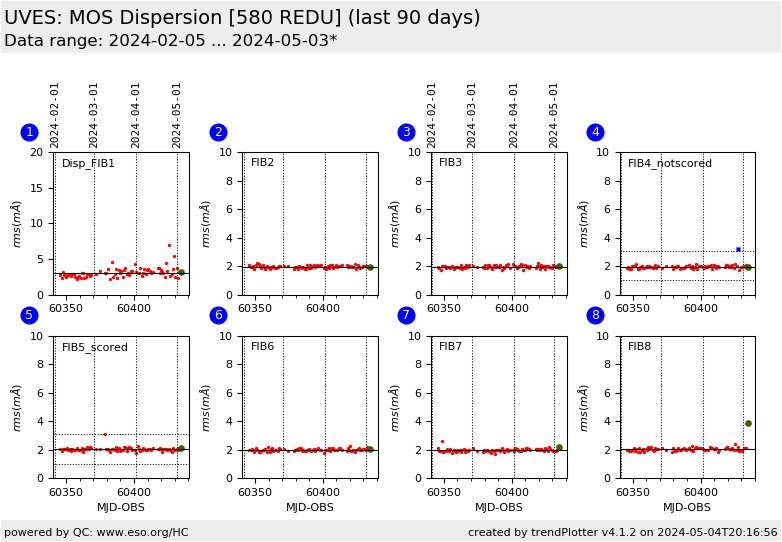
This is the trending report for FLAMES/UVES QC parameters derived for
wavelength calibration.
It covers the rms of the dispersion solution and is based
on MOS data taken with
the RED UPPER CCD in
setting 580nm, 7+1FIB, with Plate 1. These data are taken daily as part of the Daily Health Checks.
Note: only Fibre 5 is
considered in the score for this report.
The individual plots describe:
- Fibre 1: the dispersion of the solution, measured as the
rms of the residuals of the fitted wavelengths with respect to the
laboratory wavelengths.
Note that in contrast to fibres 2-8 which are illuminated by
the robotic fibre projector fed by a Thorium-Argon lamp,
fibre 1 is illuminated by the simultaneous calibration wavelength
calibration lamp.
- Fibres 2-8: the dispersion of the solution, measured as the
rms of the residuals of the fitted wavelengths with respect to the
laboratory wavelengths.
Note there is NO monitoring for fibre 9, used in the
8FIB modes.
Find more information about FLAMES/UVES wavelength solution monitoring here.
General information
Click on any of the plots to see a close-up version.
The latest date is indicated on top of the plot.
If configured,
- data points belonging to the latest date are specially marked
- statistical averages are indicated by a solid line, and thresholds by broken lines
- outliers are marked by a red asterisk. They are defined as data points outside the
threshold lines
- "aliens" (= data points outside the plot Y limits) are marked by a red arrow (↑ or ↓)
- you can download the data for each parameter set if the 'Data downloads' link shows up
|
