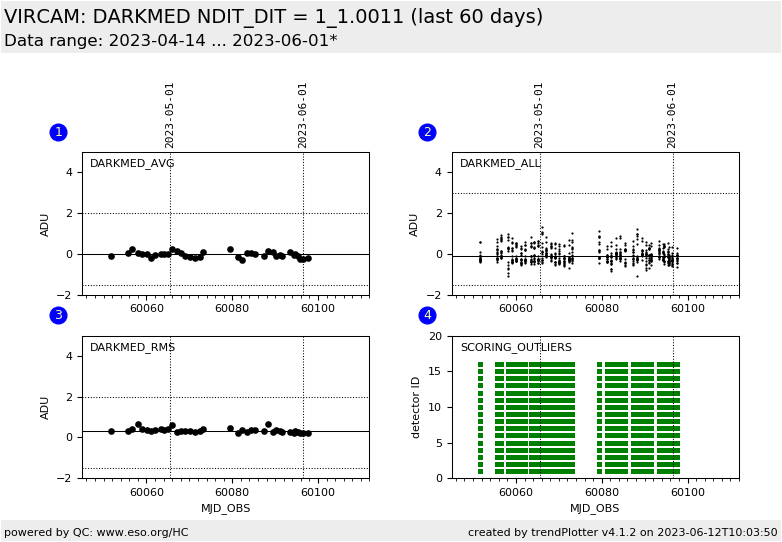
All VIRCAM Health Check Plots follow the same design:
Upper Left: Scored aggregate value. Average over 16 detector values to monitor changes of the parameter common to all detectors
Upper Right: Values of all 16 individual detectors
Lower Left: Scored aggregate value. RMS over 16 detector values to monitor the dispersion within the sample and changes to only one or a subset of detectors.
Lower Right: Internal scores of the 16 individual detectors.
Example HC plot with representative format: AVG, individual chips, RMS, scores
Dark frames are detector calibration frames to measure the counts generate
by the detector during readout, to monitor erratic light linearly
increasing with exposure time and to monitor the read out noise. Dark
calibrations are acquired with the same DIT as used by the science
observations at the end of the night or as a Daily Health Check with a
fixed set of DIT (discrete integration time) and NDIT (number of DIT) for
monitoring reasons. The following setups are covered by the Health Check:
NCORRS=Double, NDIT=1, DIT=1.001100
NCORRS=Double, NDIT=1, DIT=120.000000
The following detector setups are monitored with at least one measurement a week:
NCORRS=Double, NDIT=2, DIT=5.000000
NCORRS=Double, NDIT=6, DIT=10.000000
Only four of the many quality control parameters extracted from dark
calibrations are monitored within the VIRCAM health check plot pages and
are explained in the following; all other QC parameters are available
from the QC1 DB. In short the tags:
MED stand for the median dark level derived from the master dark pipeline product,
RON12 stands for read out noise derived from the first and the second dark raw frames,
RMS stands for the root mean square of the master dark pipeline product
STRIPE stands for the rms induced by the horizontal stripes
*Class: KPI - instrument performance; HC - instrument health; CAL - calibration quality; ENG - engineering parameter
**There might be more than one.
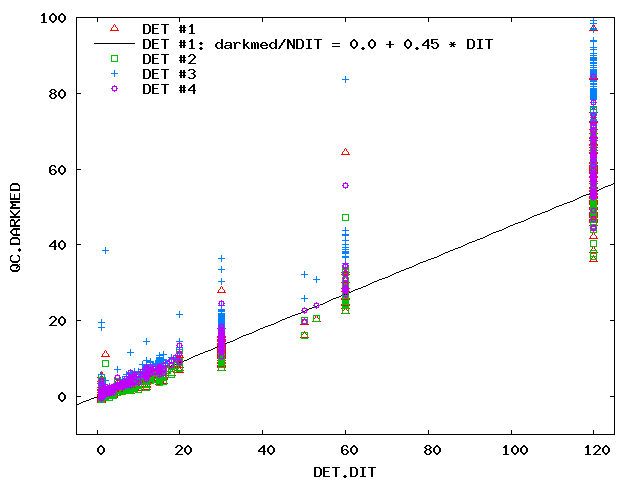
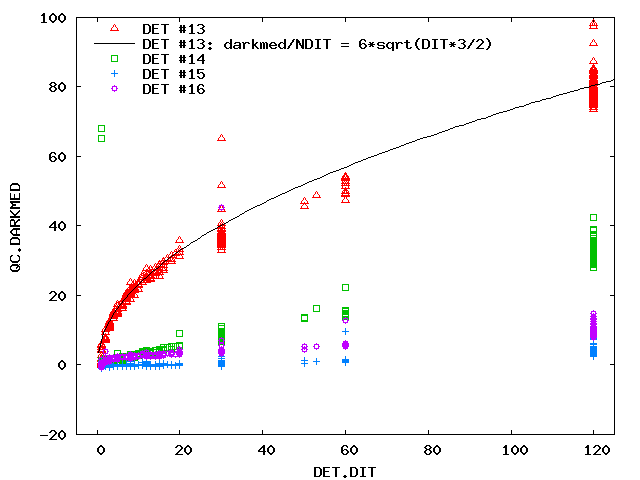
Dark level, relation with DIT and NDIT
QC.DARKMED is the median of the MASTER_DARK pipeline product frame. The
MASTER_DARK is a clean mean of the five raw DARK input frames. There are
some general properties of VIRCAM detector quality parameters. The
relation between the dark level and the DIT is given in the following
plots.
The relation: dark level versus DIT for detectors 1-4 aligned in a row.
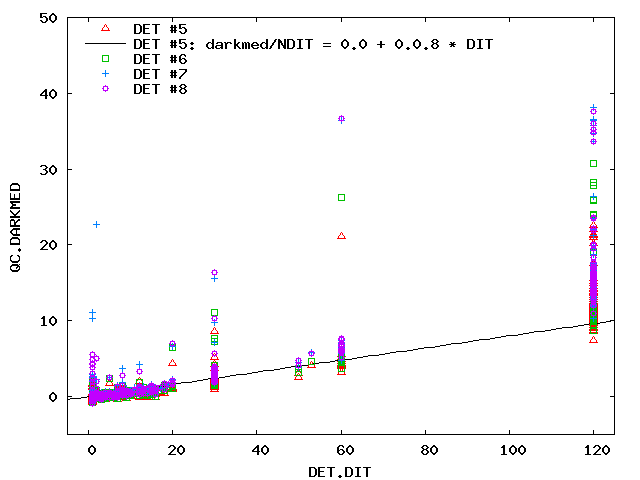
The relation: dark level versus DIT for detectors 5-8 aligned in a row.
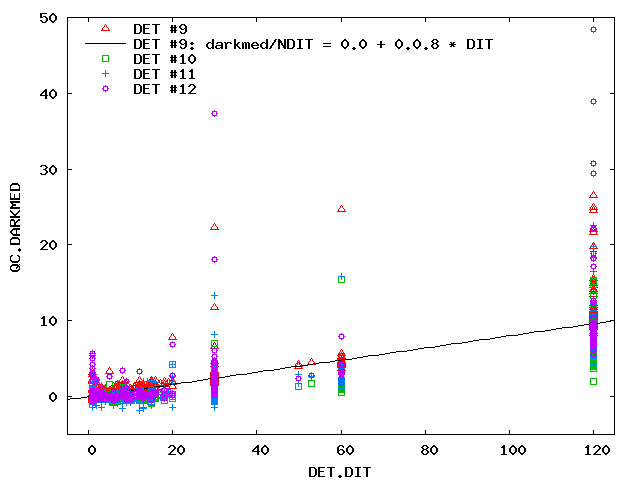
The relation: dark level versus DIT for detectors 9-12 aligned in a row.
The relation: dark level versus DIT for detectors 13-16 aligned in a row.
Note the particular reset anomaly of detector #13.
There occurs a further subtle effect: Each NDIT adds about 12 ADU to the
dark level. And each NDIT adds 1 ADU to the statistical noise. This means:
A raw frame acquired with DIT=10sec and NDIT=5 has 60 ADU more signal
and 5 ADU more statistical noise than a raw dark frame with DIT=50 sec
and NDIT=1.
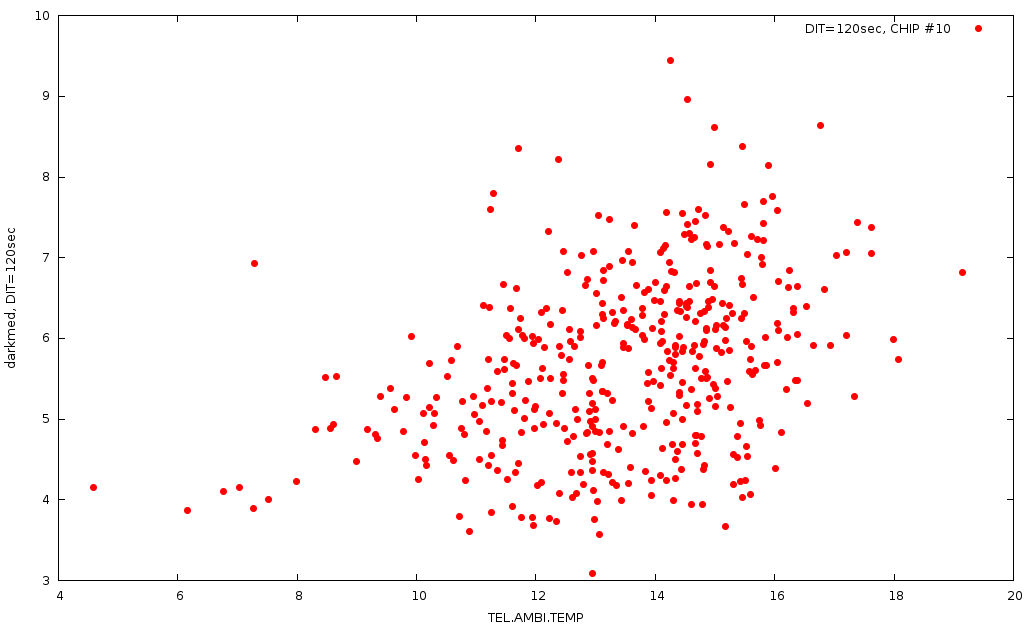
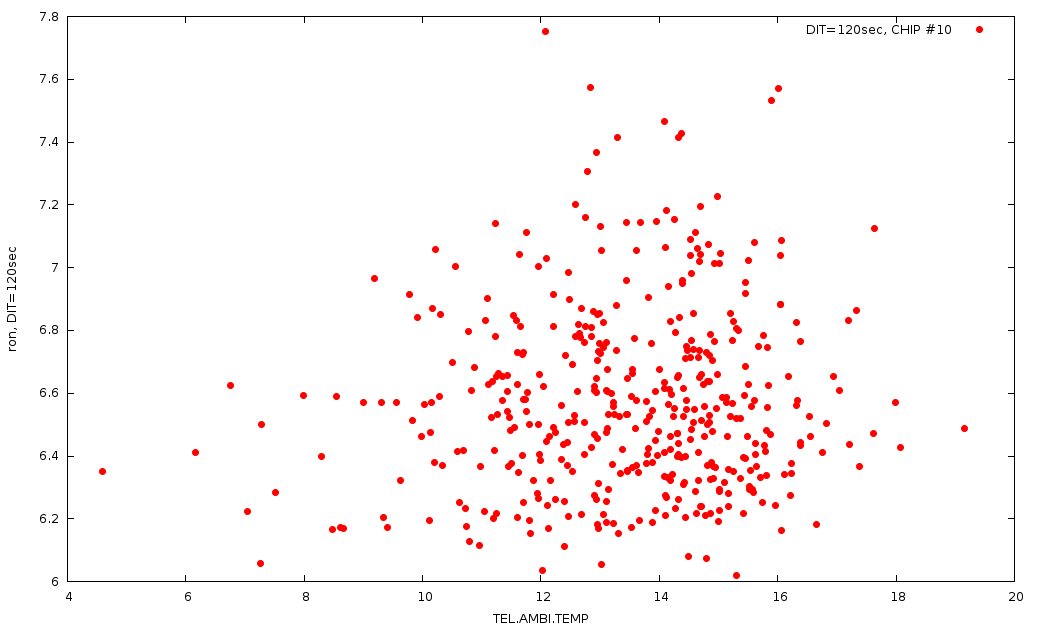
Dark level and readout noise, relation with ambient temperature
The dark level values show weak dependence on the ambient temperature.
QC parameter qc_darkmed retrieved from dark frames with DIT=120sec of detector #10
versus the ambient temperature. Data are from 2014-07 to 2015-09.
QC parameter qc_ron12 retrieved from dark frames with
DIT=120sec for detector #10 versus ambient temperature. Data are from 2014-07 to 2015-09.
Only chip #10 was uses as the read out noise from chips #1-#8 are often contaminated by the horizontal stripes feature.
Dark level and persistence
On 2019-02-10, a DARK template with DIT=120 sec was acquired twice, once before the weekly scheduled linearity sequence and once after that.
There are about 20 ADU more counts in the latter master dark due to a peristence side effect caused by the high ADU flat fields.
The persistence values, the ADU difference between both
master darks, per chip are given below:
Upper left plot shows the average over 16
detector-specific values, the lower left box shows
the rms over 16 detectors, the upper right plot shows 16
individual detector values, and the lower right plots shows the
detector specific scores.
The dark level ist monitored and scored for DIT=1.0011 sec ( = MINDIT) with thresholds of 0.3 ADU (= dark current for 1 sec) and
+- 2 ADU fluctuations induced by controller noise (= horizontal stripes).
When the instrument is warmed up and cooled down as part of a scheduled maintenance or an unexpected longer power cut on the site, the detectors show the following pattern: The dark level values and the dark rms values are higher than before the warm-up and decrease slowly in an asymptotic manner to the pre-intervention value. This might take weeks or longer. The strongest effect is seen in detectors #3, #13, and #14. The list of these events is maintained on the plot tutorial for the RESET frames.
*Class: KPI - instrument performance; HC - instrument health; CAL - calibration quality; ENG - engineering parameter
**There might be more than one.
The QC.DARKRMS is a measure of RMS obtained from MASTER_DARK frames in
ADU. It is the median of the absolute deviations from the median ( = MAD
) times 1.48. The darkrms QC parameter measures the structural noise or
fixed pattern noise in a master dark pipeline product. Only in detector
#13 with its strong reset-anomaly, the nearly linear relation between the
darkrms and the darkmed parameters ( = between the structural noise and
the counts) is established. For all other 15 detectors with negligible
reset-anomaly, the darkrms is rather constant within the small range of
registered darkmed values.
QC.RON12: subtract two consecutive DARK raw frames and retrieve a robust
estimate of the statistical noise (read out noise) via a histogram
fit. The QC parameter qc_RON12 is based on the difference of the first
two raw frames. The robust statistical noise measured in qc_RON12 is
dominated by the incoherent variable horizontal stripe pattern. The QC
parameter is hence more sensitive to amplitude of stripe variations than
the qc_striperms QC parameter. As the read out noise is composed by the
supposed statistical detector noise and the correlated controller noise,
the qc_RON12 covers both components.
Dark RMS, relation with dark level
darkrms QC parameter against darkmed for VIRCAM detector #13. Data are based on VIRCAM master darks taken between 2010-05-03 and 2010-08-03 with NDIT=1.
darkrms QC parameter against darkmed for VIRCAM detector #10.
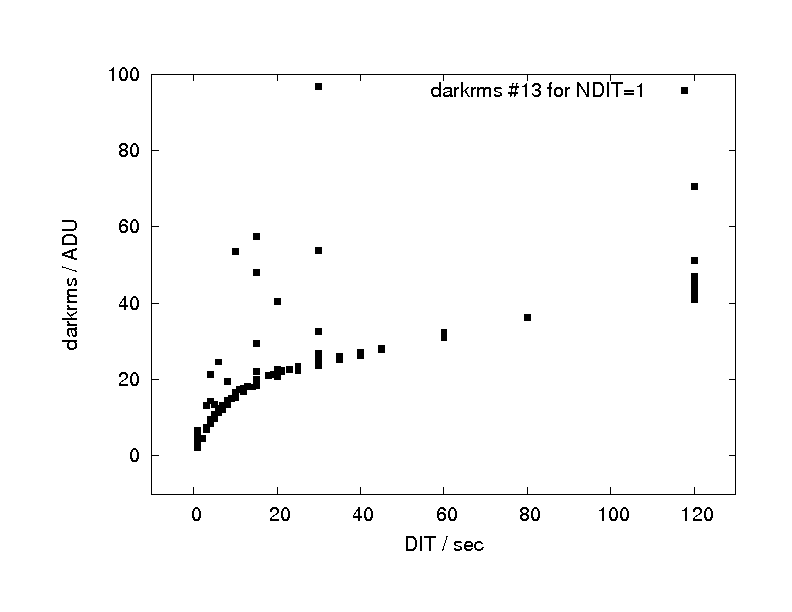
Dark RMS, relation with DIT
darkrms as function of DIT (NDIT=1) for detector #13. As darkrms is linearly related with darkmed, this Fig. shows the dominating reset-anomaly of detector #13.
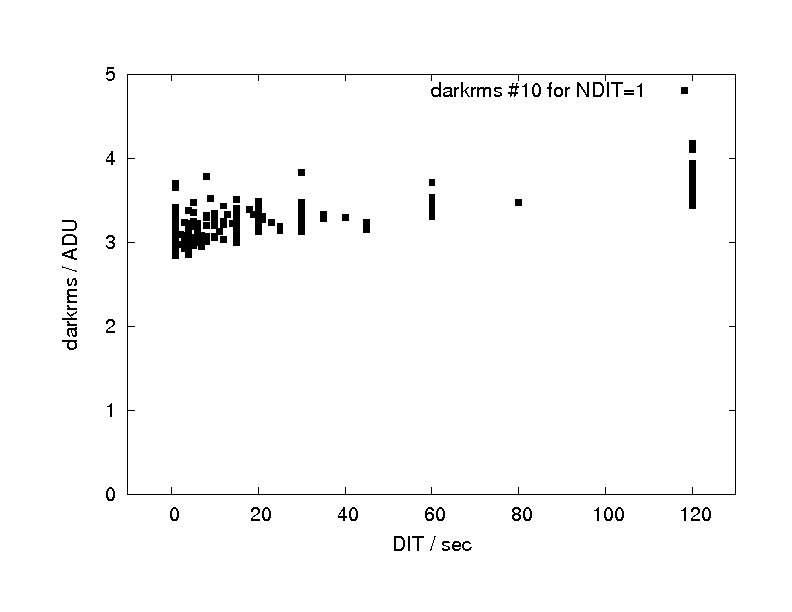
darkrms as function of DIT (NDIT=1) for detector #10 as a representative for other detectors (except #13). The variation of darkrms over DIT is negligible, a consequence of the reset anomaly.
Radiation induced charge collection
Some of the VIRCAM detectors are subject of radioactive events. Here we report on the number and the character of the radiation-induced charge collections.The following data have been analyzed:
raw dark frames with DIT=120sec NDIT=1 from 2010-07-24...27 (primary data set)
raw dark frames with DIT=300sec NDIT=1 from 2010-05-13 (to check against exposure time)
raw dark frames with DIT=120sec NDIT=1 from 2010-06-29 (to check against detector temperature)
raw dark frames with DIT=120sec NDIT=1 from 2009-11-03 (to check stability)
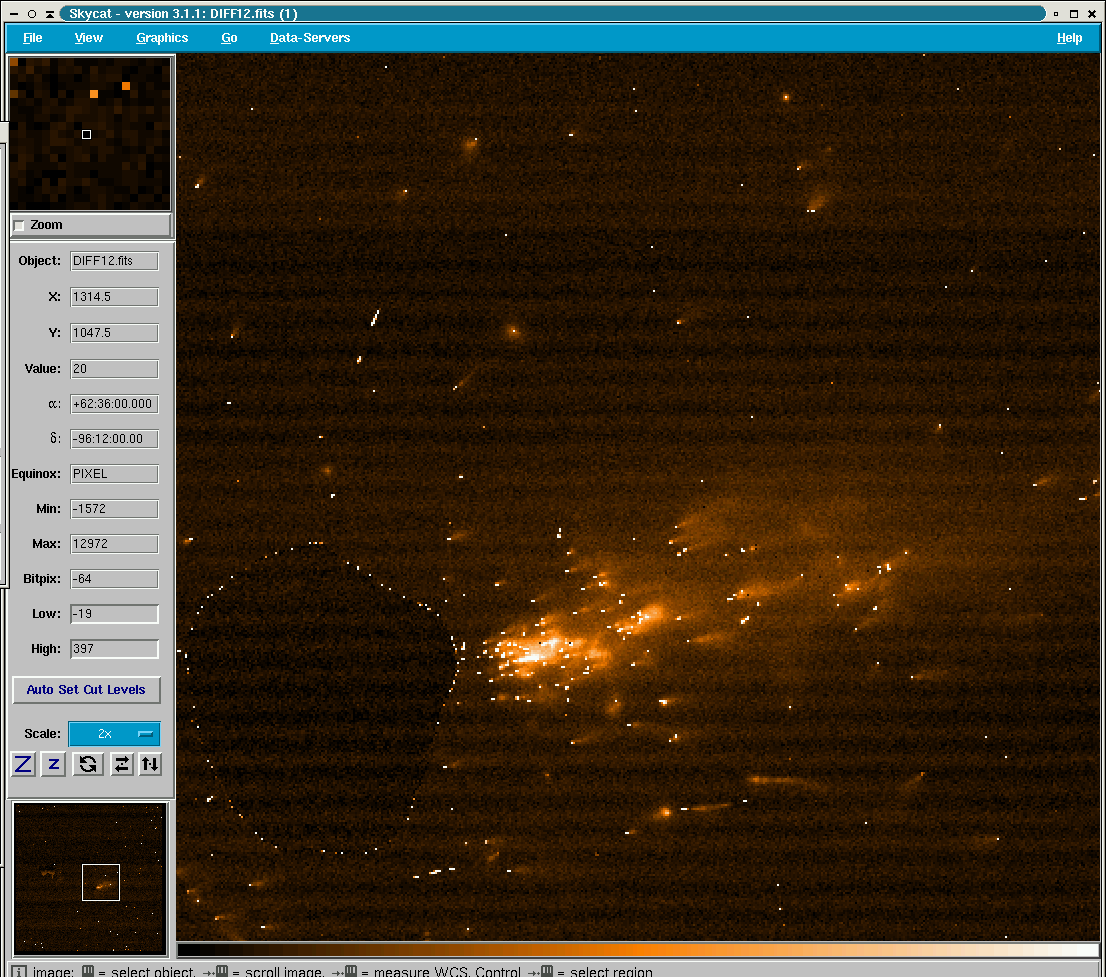
The difference between two VIRCAM raw dark frames with long DIT, show charge collections, in a similar manner as is known for HAWK-I chip #78.
Difference of two consecutive VIRCAM dark frames of chip #5 with DIT=300sec
The charge collections itself are variable in the number of counts and in
the shape. The following number of events per minute have been measured
on dark difference from the primary set (Delta n ~ +- sqrt(n)/2 ) : D
D
events / minute
1
23
2
0
3
5
4
18
5
27
6
17
7
1
8
0
9
0
10
16
11
7
12
17
13
0
14
18
15
4
16
0
The event rates have been compared with DIT=300 sec dark frames taken on 2010-05-17 in frame of the persistence tests to verify that the number of events increase linearly with exposure time.
The event rates have also been measured on dark frames acquired on 2010-06-29, when the detector temperature increased by 12 deg. The event rates are not affected by the small temperature increase.
Finally the event rates have been compared with event rates measured on DIT=120sec dark frames taken during science verification on 2009-11-03 to confirm the expected long-term stability of the event rates.
For HAWKI #72, the events are homogeneously distributed over the full detector. For VIRCAM, each detector shows a different subregion with higher event rates:
Chip #4 : upper left quadrant shows more events
Chip #5 : upper left quadrant shows more events
Chip #11 : left half shows more events
Chip #12 : lower left quadrant shows more events
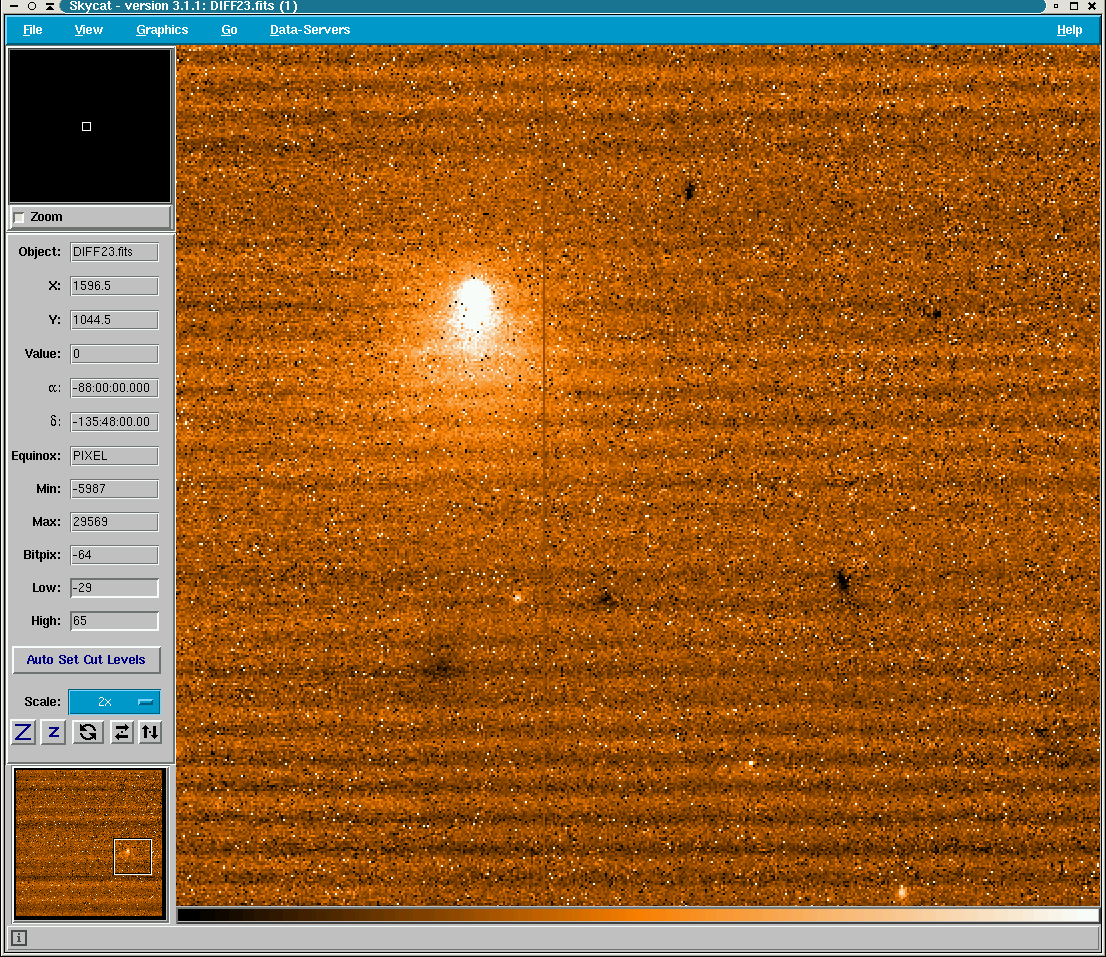
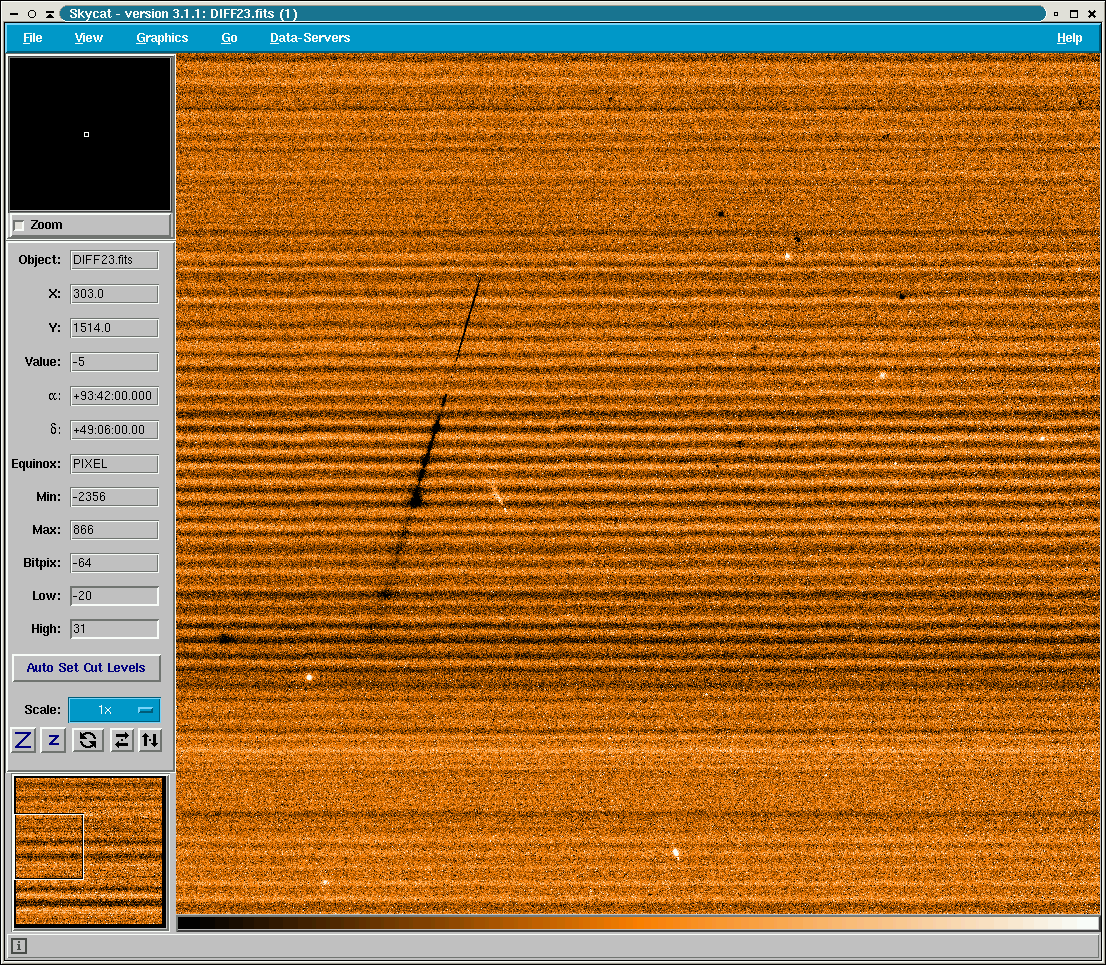
Beside the normal behavior of the events given in the Figure above,
there occurs from time to time more peculiar events collected in the
following snapshots: left: crowded event cascades, middle: deep impacts,
right: trajectory in detector plane:
The DARK RMS QC parameter is monitored for the shorted DIT of
1.0011 sec.
For other DIT, NDIT exposure time combinations it is also monitored, but the rms might be contaminated
by dark current and the stripes.
While the statistical detector noise is supposed to be stable the
correlated controller noise is not. The VIRCAM pipeline science recipe
applies a destriping algorithm, which removes the horizontal stripes
in the science product frames, meaning those stripes introduced by the
calibrations frames and those coming from the raw science frames. The
VIRCAM technical specification allows a read out noise (detector and
controller noise) of up to 32 ADU.
The readout noise, heavily contaminated by controller noise, is scored with thresholds of 4 and 10 ADU.
The rms of the master dark is scored with thresholds of 0 and 6 ADU.
When the instrument is warmed up and cooled down as part of a scheduled
maintenance or an unexpected longer power cut on the site, the detectors
show the following pattern: The dark level values and the dark rms values
are higher than before the warm-up and decrease slowly in an asymptotic
manner to the pre-intervention value. This might take weeks or longer. The
strongest effect is seen in detectors #3, #13, and #14. The list of
these events is maintained on the plot tutorial for the RESET frames.
QC.RON12: subtract two consecutive DARK raw frames and retrieve a robust
estimate of the statistical noise (read out noise) via a histogram
fit. The QC parameter qc_RON12 is based on the difference of the first
two raw frames.
*Class: KPI - instrument performance; HC - instrument health; CAL - calibration quality; ENG - engineering parameter
**There might be more than one.
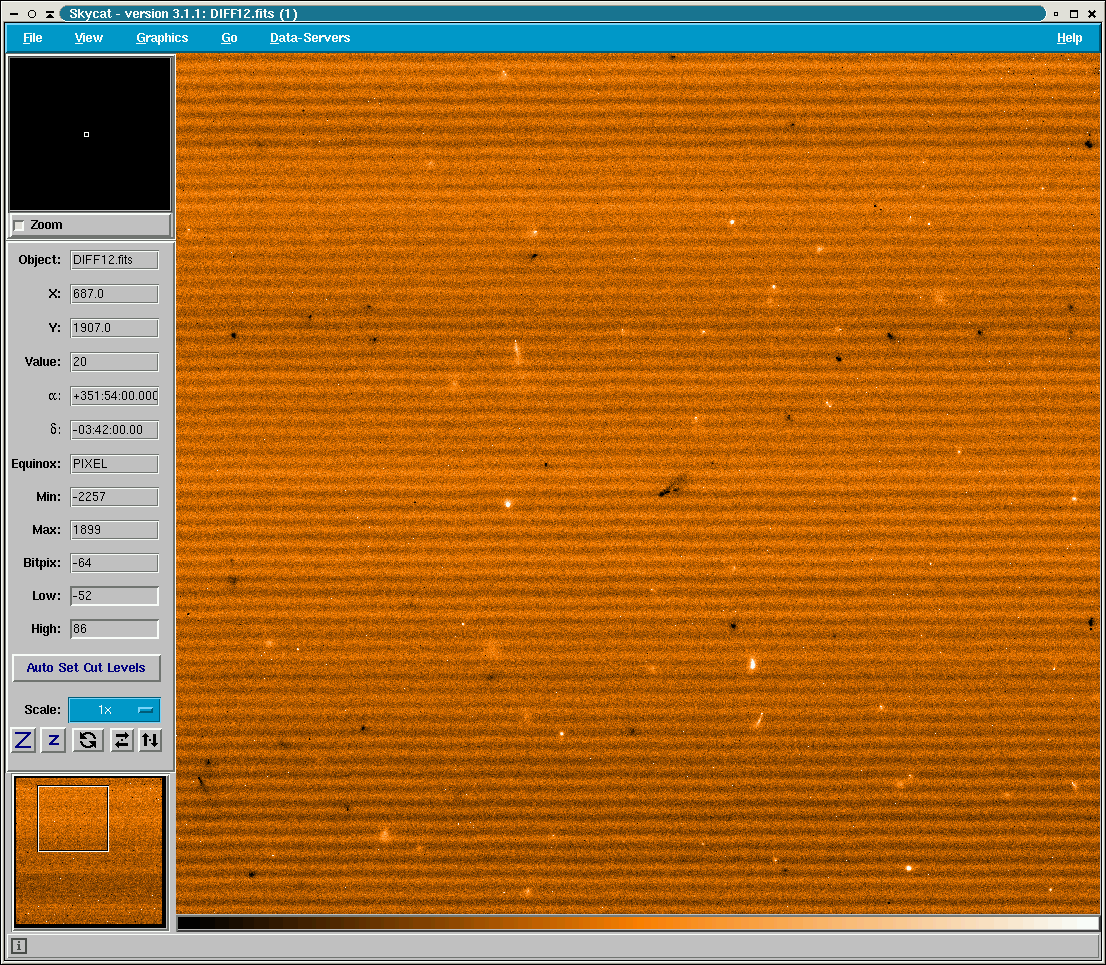
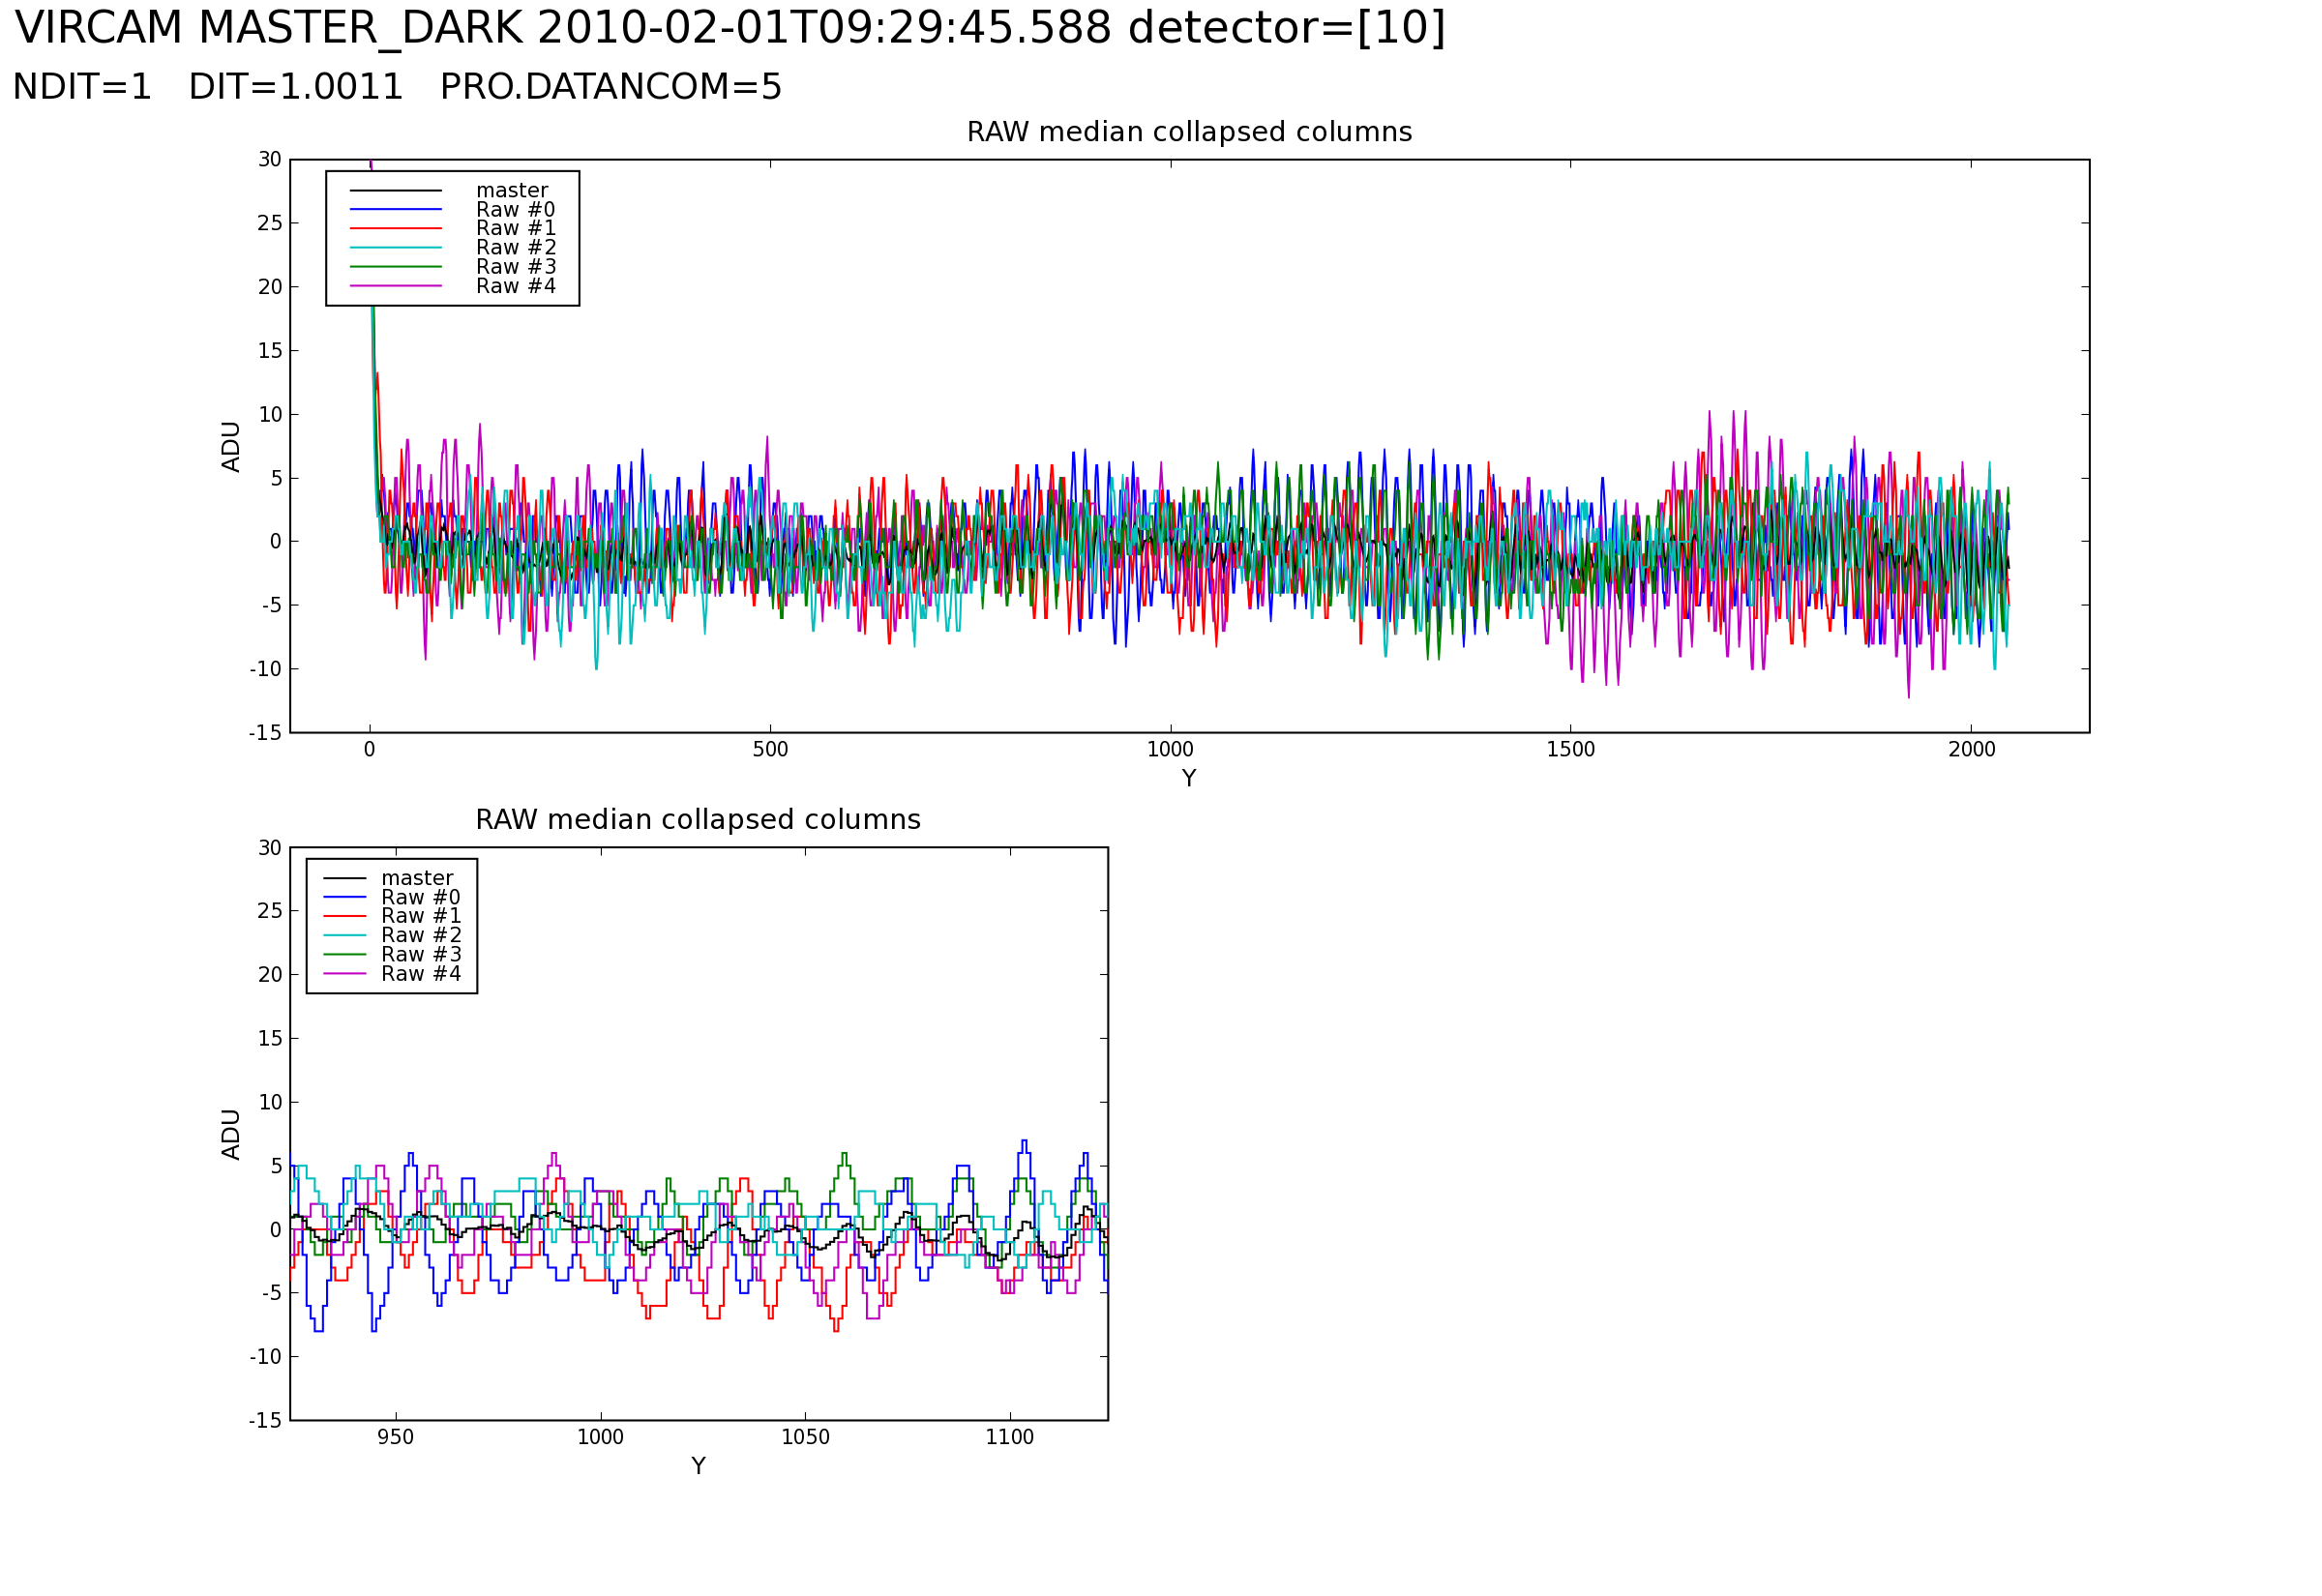
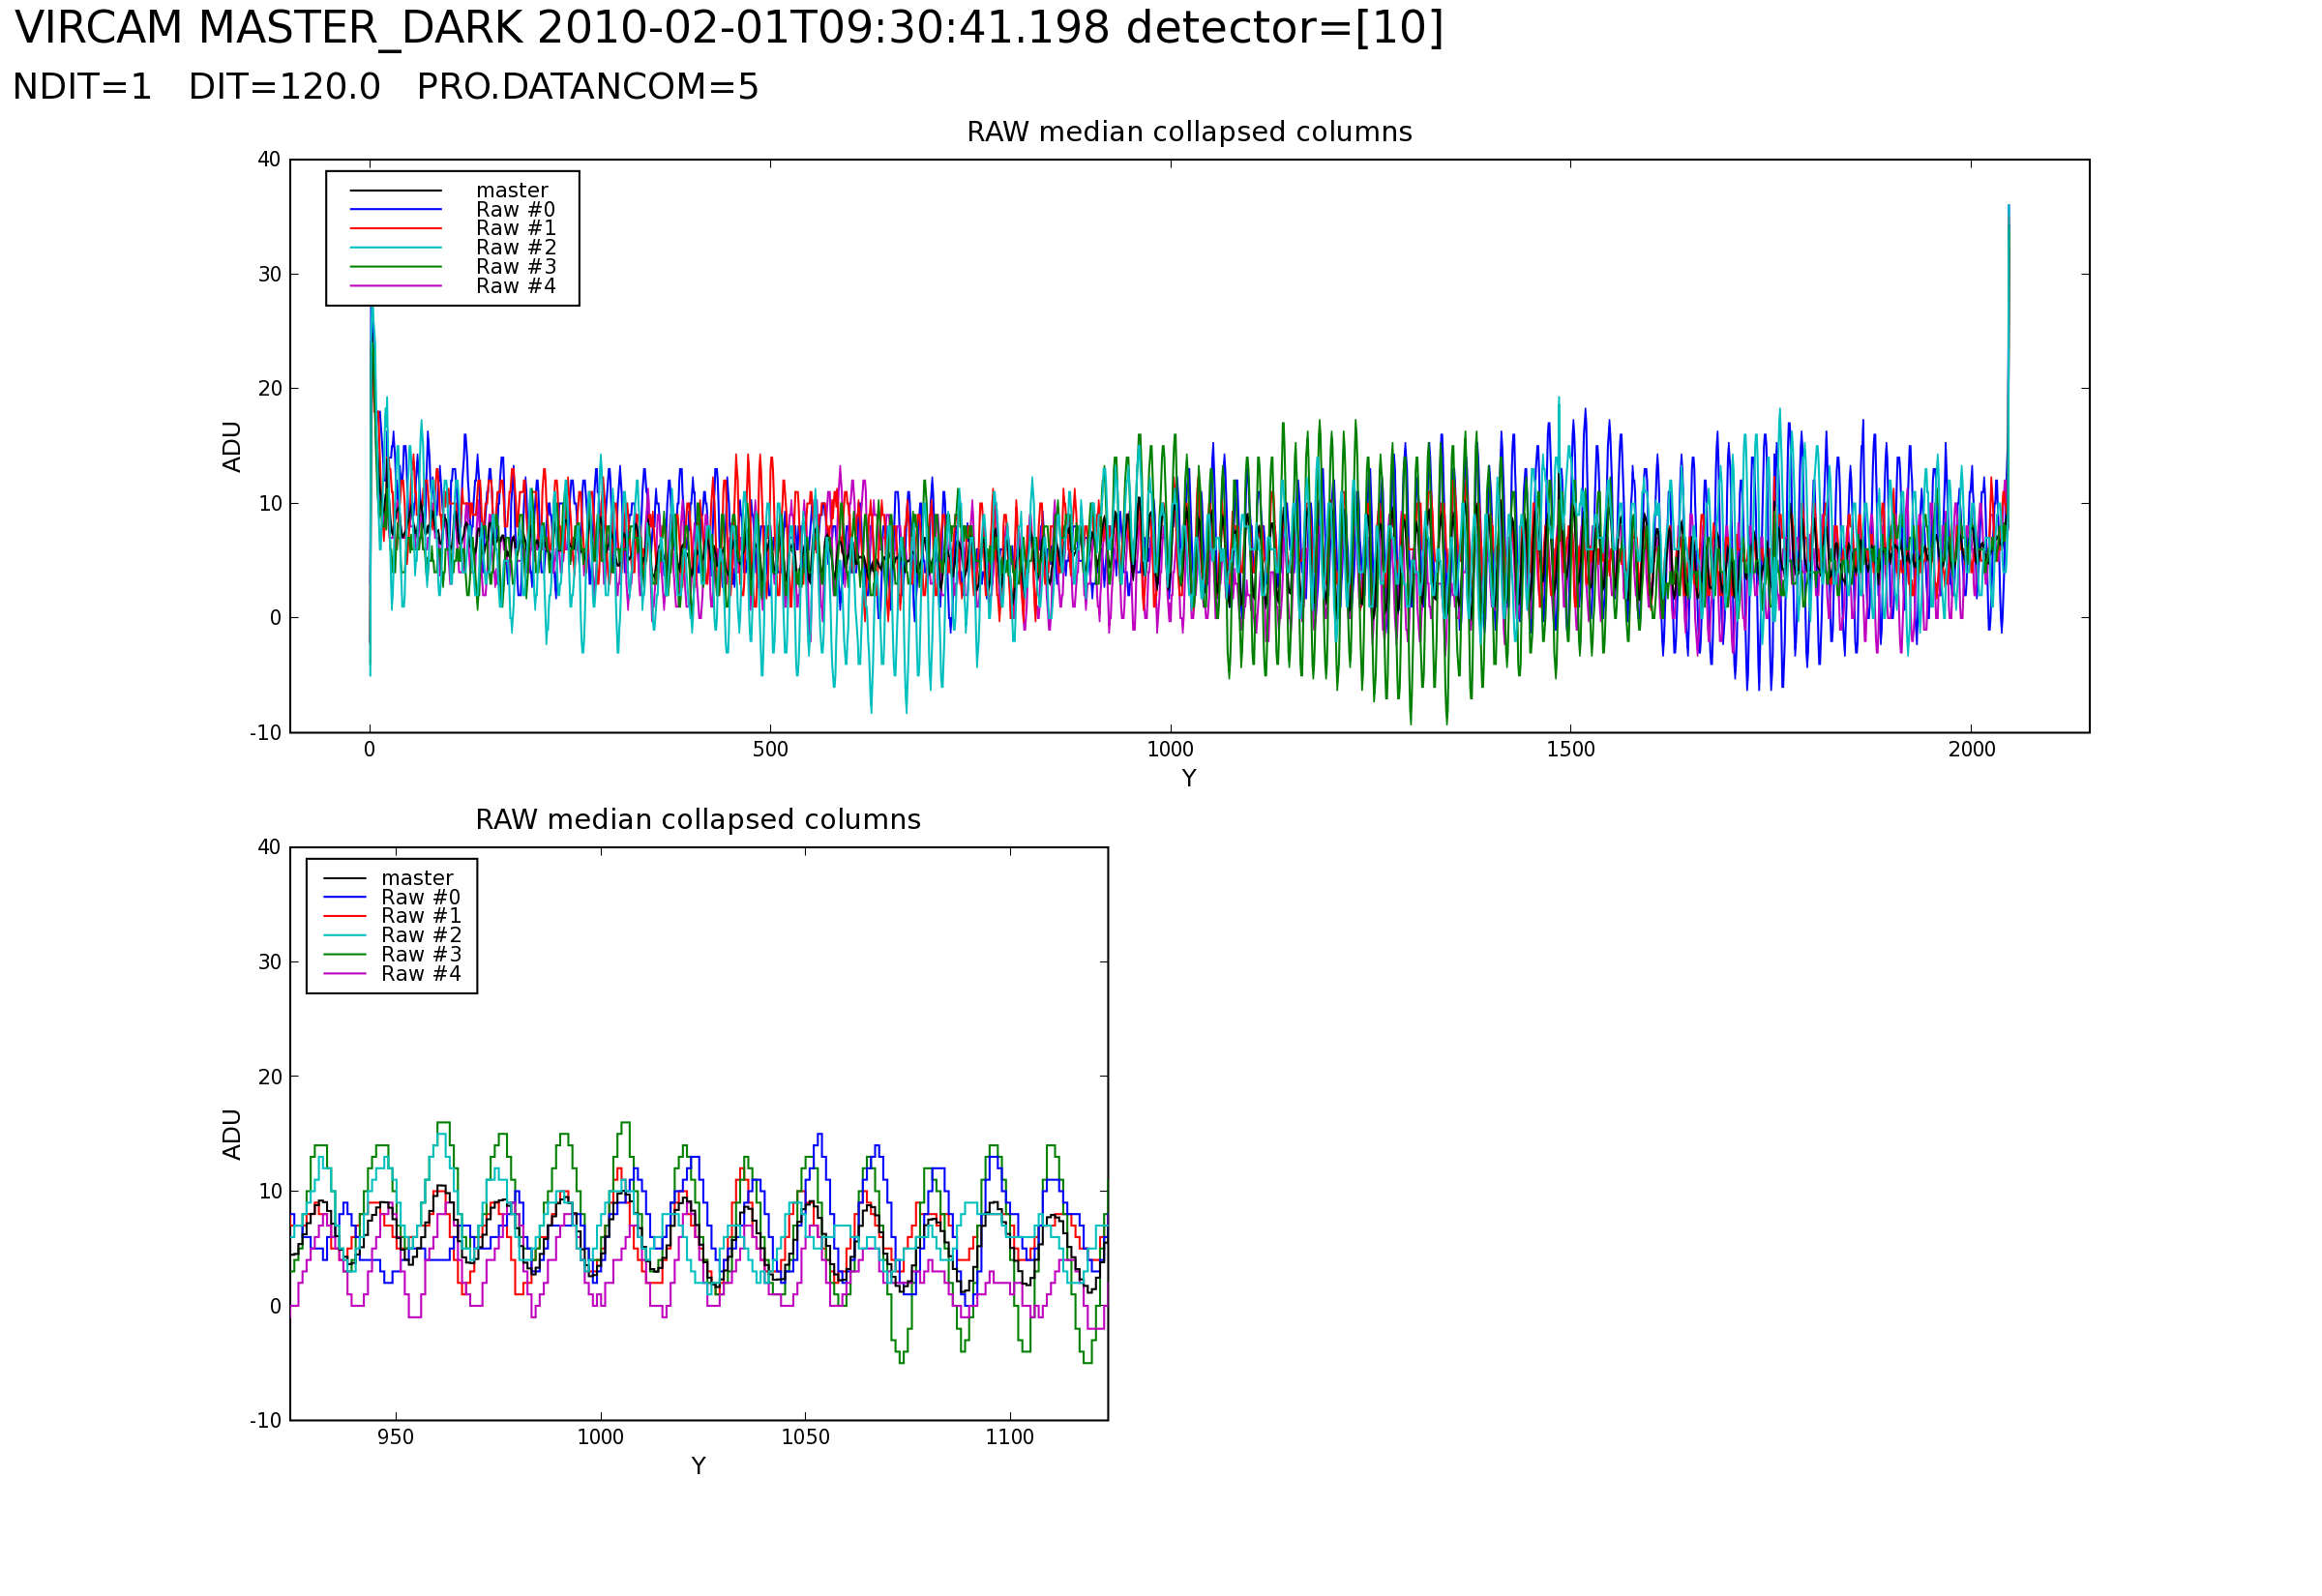
All VIRCAM raw frames show horizontal stripes for all DITs, most apparent
in dark calibrations. The stripe pattern is conserved for each group
of four detectors in a row, meaning detectors #1, #2, #3 and #4 show
the same stripe pattern, detectors #5, #6, #7 and #8 show a distinct
pattern but among themselves the same. Detectors #9, #10, #11 and #12
build another group of detectors with the same stripe pattern; detectors
#13, #14, #15 and #16 as well. The pattern is changing from readout to
readout and it is not reproducible. The frequency of the pattern, the
amplitude and the offset is variable. The master dark pipeline products
shows the interference of five raw input frame signals.
median raw dark frame columns and the averaged (black) from the corresponding master dark for DIT=1.0011 and detector #10.
click on the plot to see the entire column.
median raw dark frame columns and the averaged (black) from the corresponding master dark for DIT=120 and detector #10.
click on the plot to see the entire column.
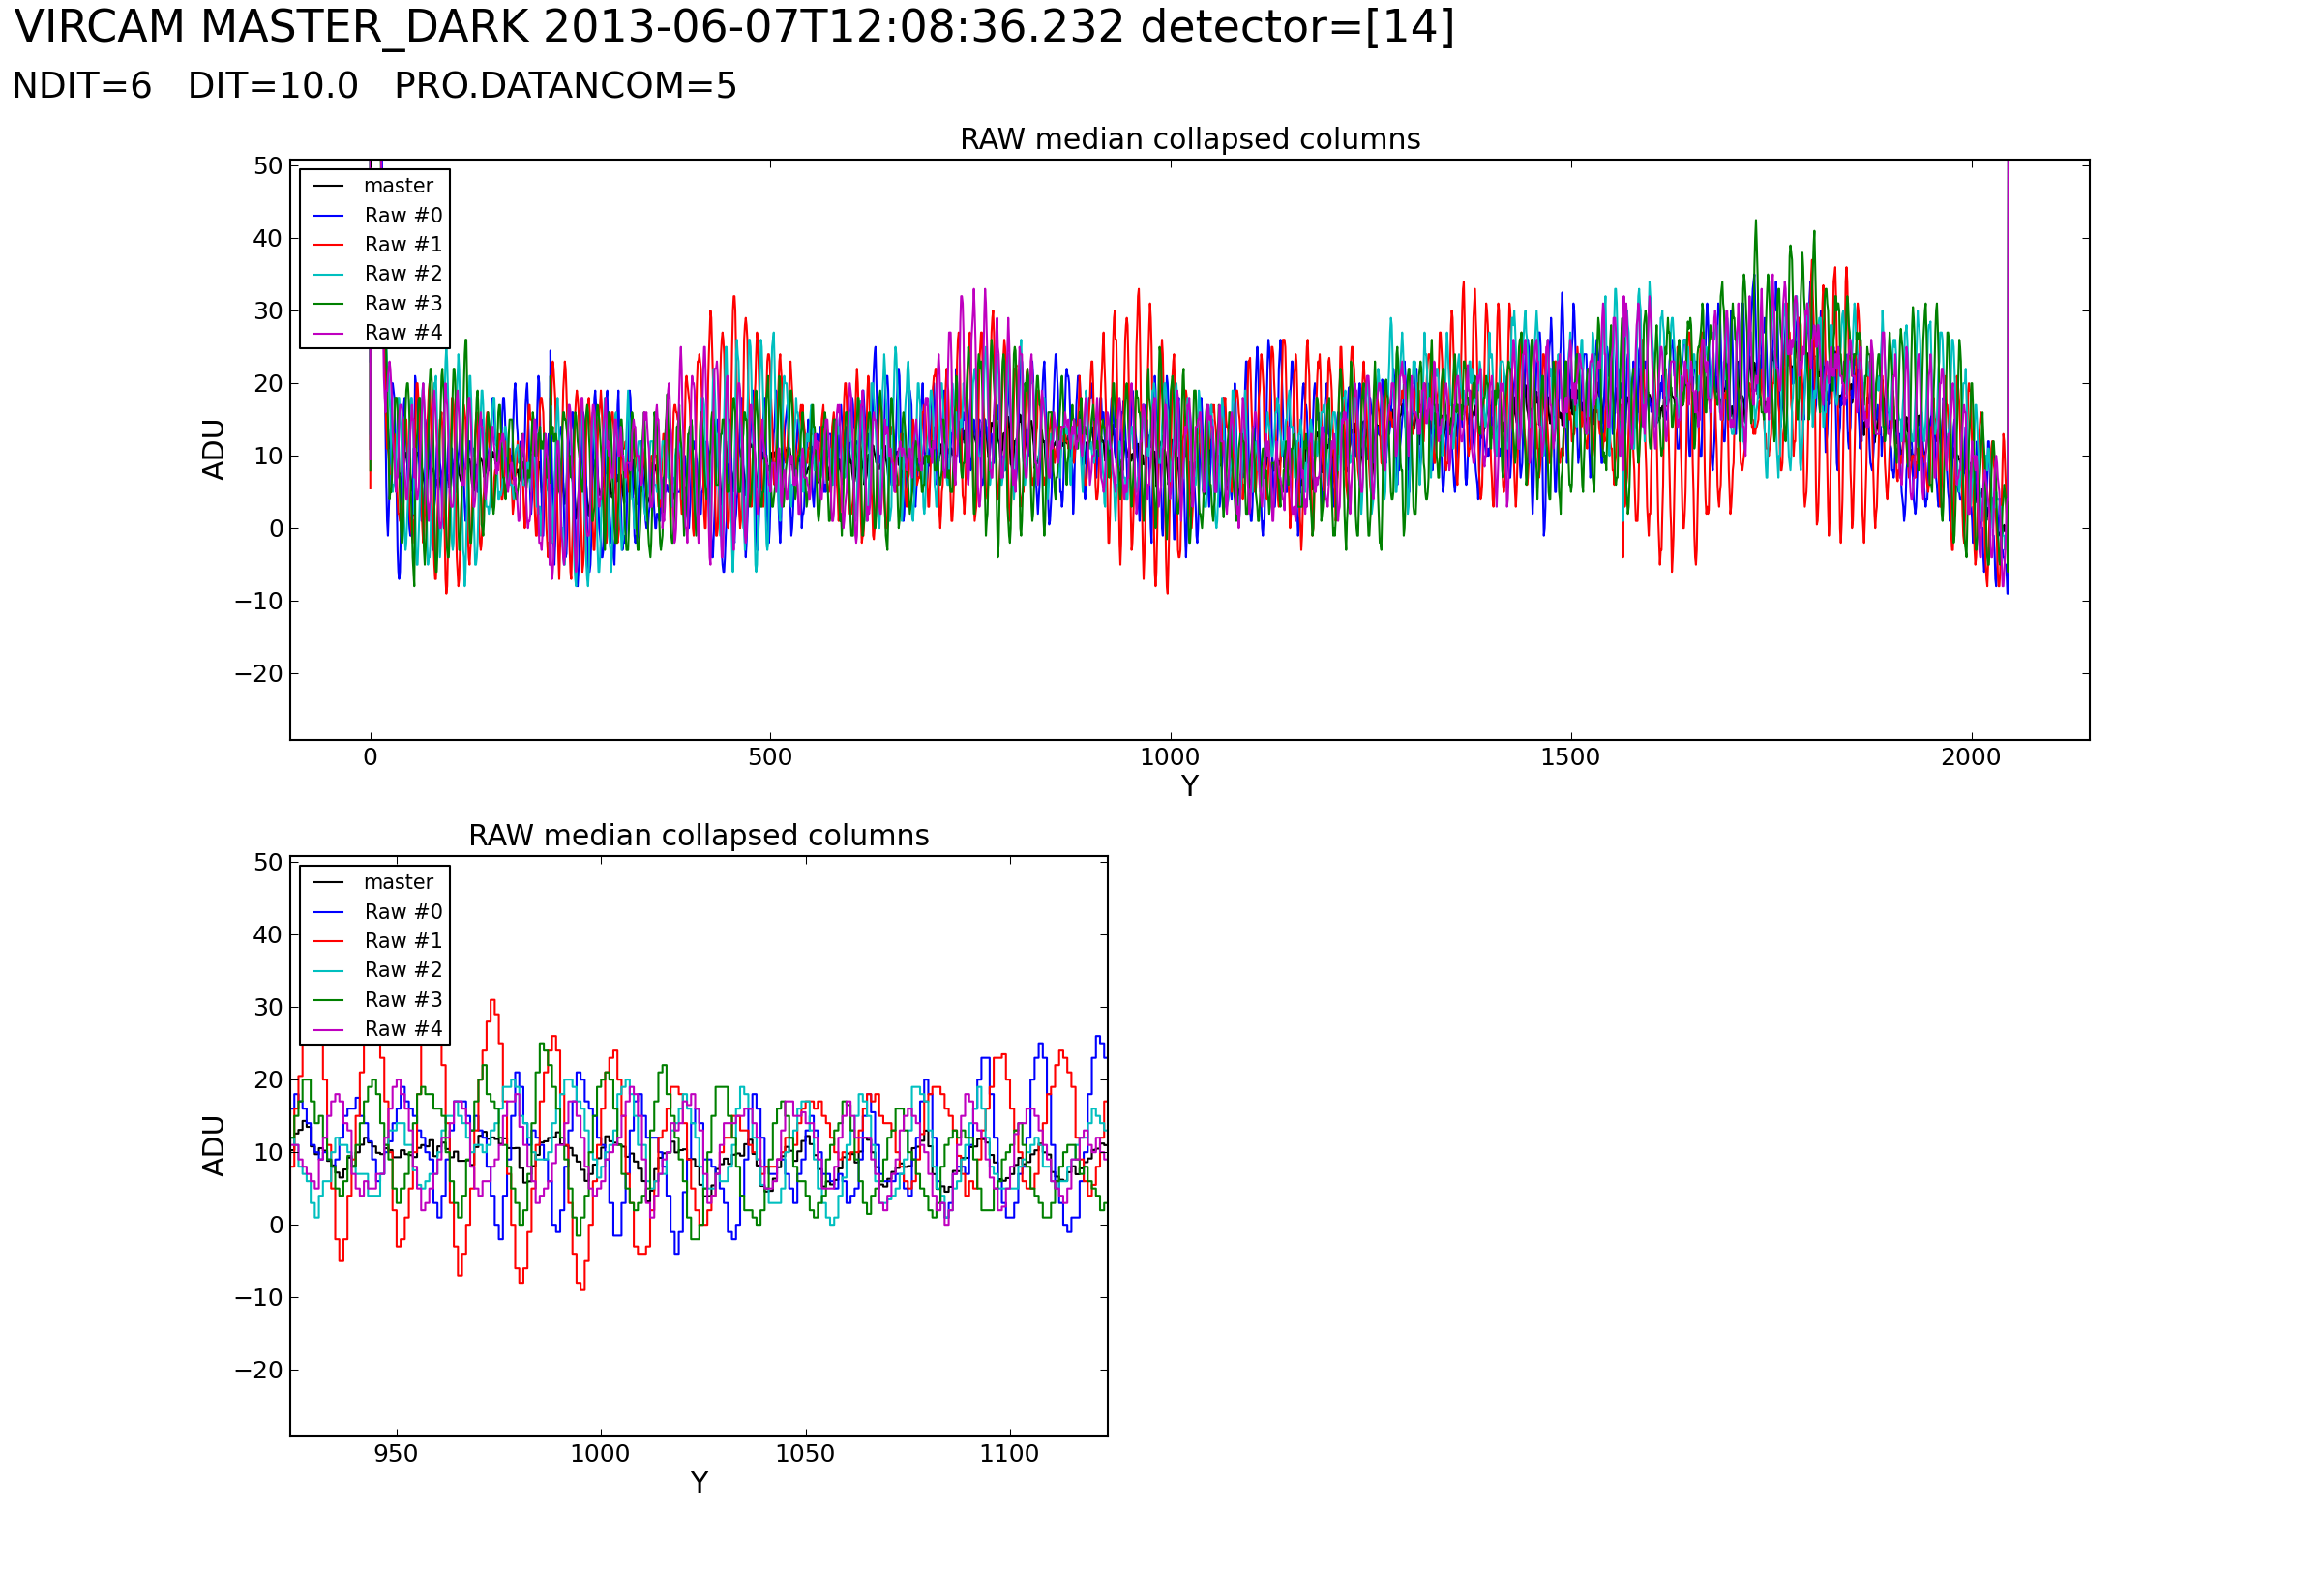
QC report of a DIT=6sec NDIT=10 master dark frame (here chip #14)
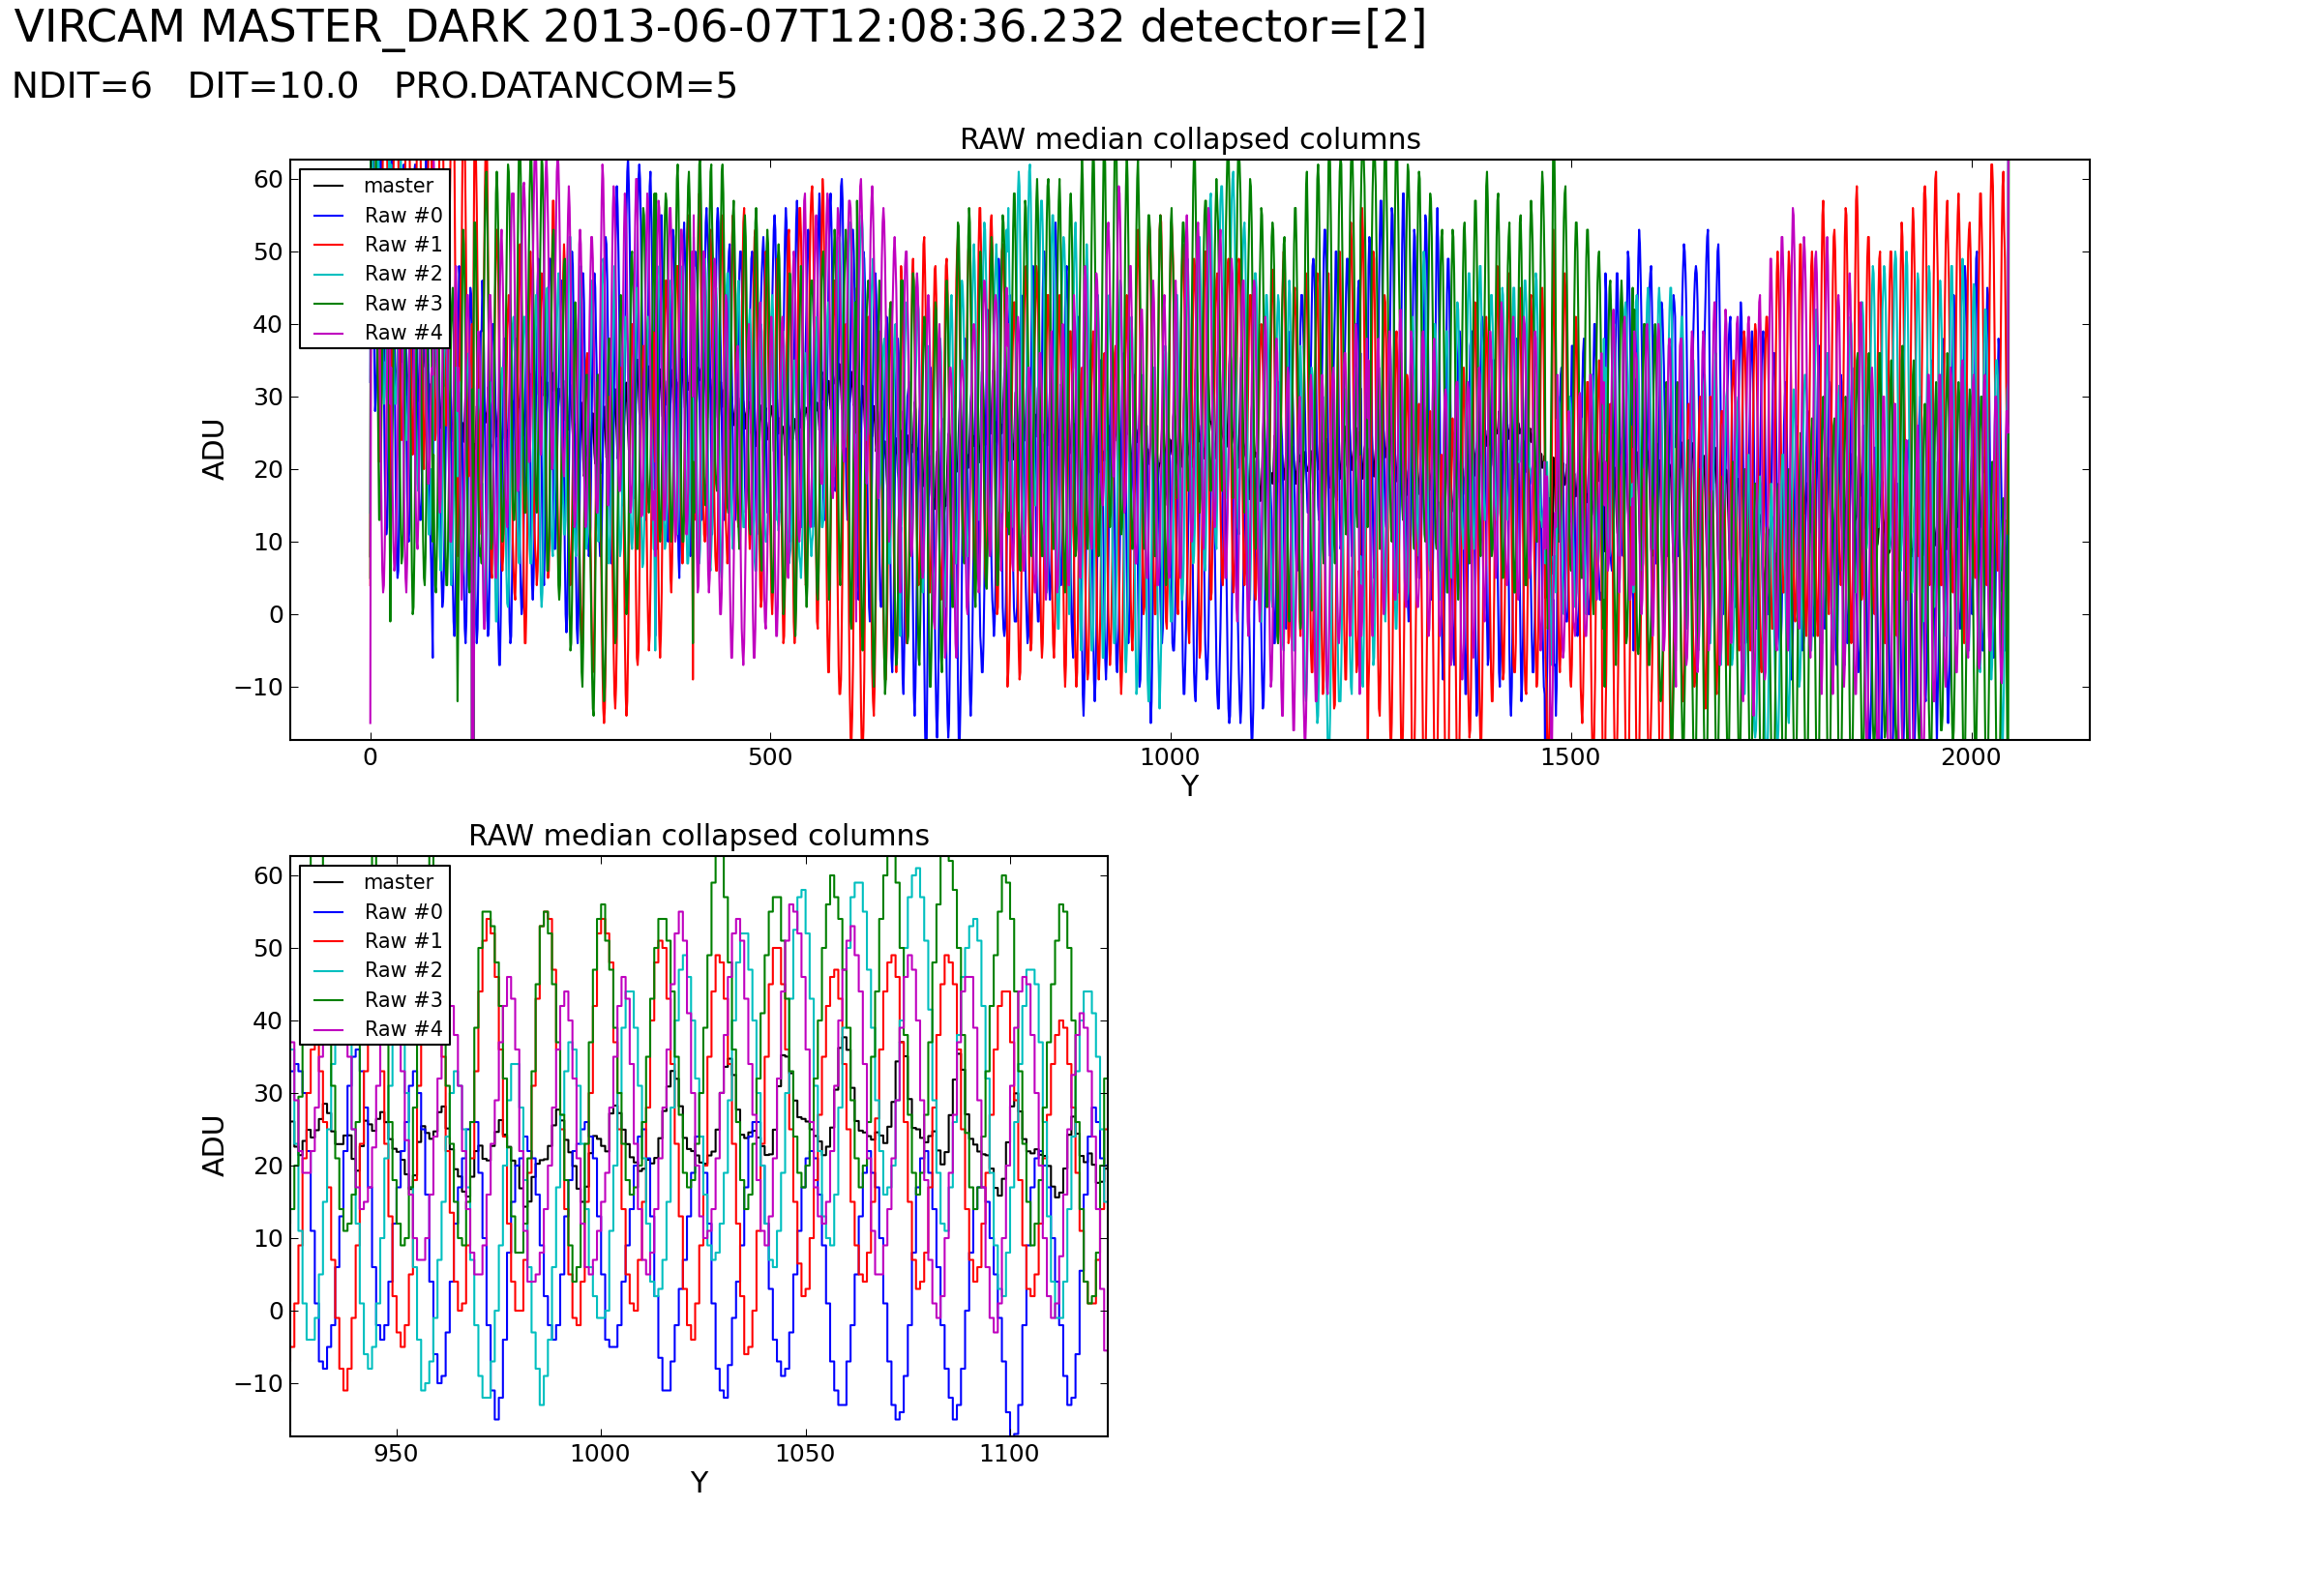
QC report of a DIT=6sec NDIT=10 master dark frame (here chip #2) with stronger stripes.
Horizontal stripes have the following implications
Stripes are not corrected in any of the vircam pipeline
recipes. Therefore pipeline products, like master dark frames contain
the stripe pattern averaged over the N raw input frames (black line in
the plots).
For the instrumental quality control, features in dark frames
with amplitudes of the order of or smaller than the typical amplitude
of the horizontal stripes cannot be resolved.
For the dark recipe: When the stripe pattern of the five
consecutive raw frames is coherent, the readout noise QC parameter
derived from raw difference frames is rather low, since the pattern
mostly cancels out, but in the master dark the pattern is averaged and
is therefore enhanced. When the stripe pattern is mostly non-coherent
in the five consecutive raw frames, the readout noise QC parameter is
rather high, since the raw difference frames enhances the pattern, while
in the master dark product the stripes average out and are less strong.
Analysis of the detector linearity using the ESO detmon recipe
has demonstrated, that the interpixel capacitance is contaminated and
biased by the stripe pattern.
For this reason this detector property cannot be monitored.
For the monthly acquired gain calibrations, which consist of two
dark frames and two flat frames, the horizontal stripes bias the
measured noise values (photon noise and read out noise). Variations
in the stripe pattern amplitude impact the derived gain value by
up to 20%. Pairs of low stripe amplitude dome flat and dark frames
(all with the same DIT) can provide less contaminated gain values,
than the raw frames generated by the gain template. For quality
control operations, the read-noise QC parameter of the gain recipe
is most sensitive to stripes and is used to asses the quality of
the gain calibrations.
The stripe pattern, as they show up in median stacked master dark frames are monitored by the stripe rms QC1 parameter and via the RON12 parameter, which is strongly biased by the stripes.
While the statistical detector noise is supposed to be stable the correlated controller noise is not. The VIRCAM pipeline science recipe applies a destriping algorithm, which removes the horizontal stripes in the science product frames, meaning those stripes introduced by the calibrations frames and those coming from the raw science frames. The VIRCAM technical specification allows a read out noise (detector and controller noise) of up to 32 ADU.
 Dark level