VIRCAM trending system: HEALTH CHECK report
Last update: 2023-06-12T09:52:24 (UT)
[enable javascript for displaying time difference!]
*Date on this monitor changes at 21:00 UT
png: Information and research:
- png file
- advanced studies:
QC1 browser |
QC1 plotter
2009-05-28: Scoring (red/green squares in the group bar and in the navigation bar) is on the
detector average (Fig. 1) and detector rms (Fig. 3) values alone.
2009-05-28: Scores of individual detector values (Fig. 4) are for detailed analysis but do not contribute to the
overall instrument score.
2010-02-25 detector average and RMS photometric zeropoints will no longer be scored.
2022-12-01 modified bad pixel map (channel #16 in chip #15 is flagged) is used for the twilight flat recipe and the photometric standard star recipe
in order to generate more robust zeropoints.
Plot? Symb? Source Average ? Thresholds ? N_ QC1 Data Remarks
method value unit method value
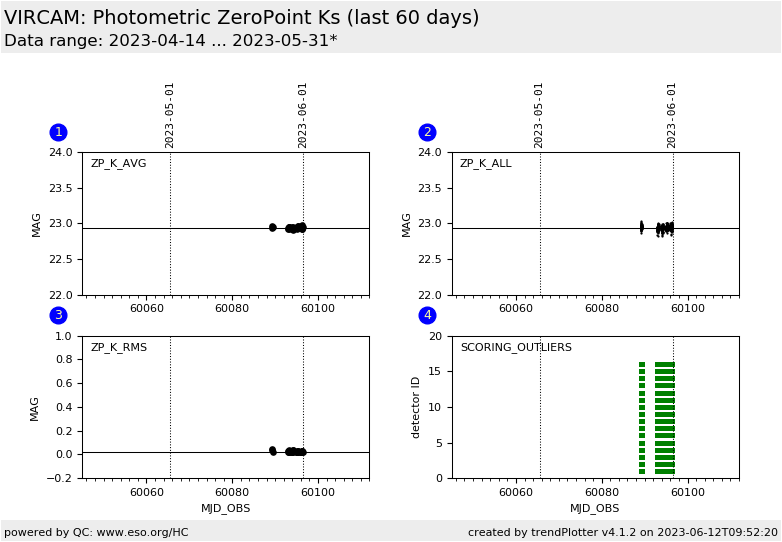
1
• QC1DB MEDIAN 22.9 MAG none 38 qc_magzpt
this |
last_yr |
all
Photometric Zeropoint Ks, average over all 16 detectors
2
• QC1DB MEDIAN 22.9 MAG none 608 qc_magzpt
this |
last_yr |
all
Photometric Zeropoint Ks, values of all detetcors
3
• QC1DB MEDIAN 0.0235 MAG none 38 qc_magzpt
this |
last_yr |
all
Photometric Zeropoint Ks, stdev over all detectors
4
■ LOCAL none MAG none 608 qc_magzpt n/a Score per Detector: Green = within the thresholds
4
■ LOCAL none MAG none 0 qc_magzpt n/a Score per Detector: Red = beyond thresholds
*Data sources: QC1DB: QC1 database; LOCAL: local data source
Plot 1 scores: not implemented
data source: vircam_photstd dataset: qc_magzpt • median: 22.9 MAG thresholds: none N_data plotted: 38 [click plot for closeup]
Plot 2 scores: not implemented
data source: vircam_photstd dataset: qc_magzpt • median: 22.9 MAG thresholds: none N_data plotted: 608 [click plot for closeup]
Plot 3 scores: not implemented
data source: vircam_photstd dataset: qc_magzpt • median: 0.0235 MAG thresholds: none N_data plotted: 38 [click plot for closeup]
Plot 4 scores: not implemented
data source: local data source dataset: qc_magzpt ■ average: none thresholds: none N_data plotted: 608 [click plot for closeup]
This plot
The scoring thresholds of the individual chips used in box (4) are:
CHIP_16 22.03 24.03
CHIP_15 22.03 24.03
CHIP_14 22.03 24.03
CHIP_13 22.03 24.03
CHIP_12 22.03 24.03
CHIP_11 22.03 24.03
CHIP_10 22.03 24.03
CHIP_9 22.03 24.03
CHIP_8 22.03 24.03
CHIP_7 22.03 24.03
CHIP_6 22.03 24.03
CHIP_5 22.03 24.03
CHIP_4 22.03 24.03
CHIP_3 22.03 24.03
CHIP_2 22.03 24.03
CHIP_1 22.03 24.03
General information
Click on any of the plots to see a close-up version .
The latest date is indicated on top of the plot.
If configured,
data points belonging to the latest date are specially marked statistical averages are indicated by a solid line, and thresholds by broken lines outliers are marked by a red asterisk. They are defined as data points outside the
threshold lines "aliens" (= data points outside the plot Y limits) are marked by a red arrow (↑ ↓ you can download the data for each parameter set if the 'Data downloads' link shows up
