| topics: Update information and documentation || result table | instrument info and configuration | long-term calibrations | CAL4CAL || buttons: forced | analysis ISSUES | mark BAD QUALITY || replication |
The calChecker monitor provides information about the calibration completeness and calibration quality. It is developed and maintained by QC Garching.
Find
general information about the process here.
|
Science and CAL4CAL checks
|
|||
| |
If both tabs are enabled, calChecker for
this instrument is configured for science checks and for CAL4CAL checks
(calibrations for calibrations). It comes with two main result pages.
|
||
| no cal4cal |
If only the 'science' tab is enabled, this instrument is not configured
for CAL4CAL checks (because they make no sense
here).
|
||
cal_scores: The completeness flags (OK, NOK or MISS, see below) are cumulated to calibration scores (cal_scores), along the same principles as the quality scores on the HC monitor.
| all calibrations existing and within validity time range | |
| issue with outdated or missing calibrations but daytime calibs not yet finished | |
| issue with outdated or missing calibrations |
tellTracker: A few instruments have a third module of calChecker enabled, called tellTracker:
| |
|
tellTracker |
|
||
The tellTracker is designed to follow up time-critical nighttime calibrations, like the telluric standard stars. Find more information about tellTracker here.
Update information and documentation
| Last update: | 2008-02-22T07:12:07 (UT) |
|
Paranal date*: 2008-02-21 | ||
| Last header: GIRAF. | 2008-02-22T05:21:51.420.hdr | *Date on this monitor changes at 21:00 UT |
Last update: timestamp of creation of this page (UT)
Last header: name of last header file currently available; compare this timestamp to 'Last update' to see if monitor is up-to-date
| (0d 00h:02m ago) | current age of the monitor page (time elapsed since last update); it is green if the last refresh is less than 2 hours ago (requires javascript enabled) | |
| (0d 13h:36m ago) | a problem has occurred (could e.g. be: problem with hosting machine, or network, or database) |
| transfer | monitors the health of the data transfer system (DTS) from Paranal to Garching Archive (ngas); green if no CALIB file delayed by more than 1 hour, otherwise red; red alert may explain processing problems | |
| ngas | monitors the QC access to the archive (ngas); green if download possible, otherwise red; red alert may explain processing problems |
What to do if the calChecker page is outdated? (intended for our Paranal partners)
calChecker is supposed to run for every instrument once per hour during daytime and twice every hour during nighttime, 24/7. If it is not refreshed within 2 hours, the "ago" box will tell you (it is calculated by your browser and will turn red after 2 hours). The first thing to then check is: does this problem show up only for the current instrument, or for others as well? If so, then it is most likely a network or a database problem. If you think the problem is on the Paranal side, check first with DHA. If you think it is specific to one instrument / QC account, send a mail (use the "contact" link if you expect the QC scientist to be able to read it; to the general list qc@eso.org, if not. On a weekend general problems will most likely be picked by the Garching maintenance teams, they provide service 7 days a week during daytime. Ask DHA for support, they know whom to contact.
What to do if the "transfer" or the "ngas" watch flag are red? (intended for our Paranal partners)
Both flags watch the health of the data transfer process and the data access process for QC to NGAS. They are not of prime importance for calChecker but for data processing and for the "products" links displayed.
The transfer watch flag checks the health of the bbcp data transfer between Paranal and Garching Primary Archive. It turns red if CALIB files are found with delivery delays of more than 1 hour. If it is red, please consult first the DataTransferMonitor linked to the calChecker, or consult DHA. They will analyze if the problem is on the Paranal or the Garching side, and contact the right people if necessary.
The ngas watch flag monitors the QC data access to NGAS, the primary archive system in Garching. If access is not possible, data processing is not possible and may explain certain effects on the AB product monitor. For both watch flags it is true that if they show red, they should be red on all instrument versions of the calChecker, modulo execution timestamp of course. So you may want to check this first. Contact DHA and/or the QC scientist(s) for further investigation.
Paranal date: logical current date for this tool (change of date occurs at 21:00 UT in order to have daytime calibrations sorted under the same date as night-time science). Note that this convention differs from the one for some other processes (e.g., Paranal nightlog and opslogs change date at 12:00 LT).
Further information:
| HELP | ASSOC-RULES | |
| this file | association rules used | results sorted by setup (also linked under "action required") |
News: there is a "general news" section and an instrument-specific news section:
|
General news:
|
Server down Saturday
10:00-12:00 Garching time
|
|
<ins> news:
|
Issue with X-Shooter calibrations
from yesterday; please take again.
|
Buttons:
|
|
There is a number of buttons triggering the following actions:
- 'HC' links to the HC monitor for that instrument.
- 'refresh' is a button to launch a refresh of the calChecker tool for that instrument. More here.
- 'analyze ISSUES' is a button for the analysis interface. More under analysis editor.
- 'mark BAD QUALITY' is a button for the 'bad quality' interface. More here.
Links:
![]() HELP
| Q&A | ASSOC-RULES
HELP
| Q&A | ASSOC-RULES
![]() history
... | contact
history
... | contact ![]() DataTransferMonitor
| BandWidth
DataTransferMonitor
| BandWidth
- HELP links to this help page.
- Q&A provides some background information.
- ASSOC-RULES links to the association rules used on the calChecker.
'history' links to a directory with calChecker result pages for earlier dates. The contact link can be used to send a mail to the QC scientist for that instrument.
There is a link to the DataTransferMonitor (powered by SDD), in case you want to check in detail which data have already been transferred to the Garching archive and are accessible to QC Garching. The Bandwidth monitor link (powered by DHA) monitors the current and past bandwidth usage.
| daytime calibs: | [daytime calibrations ongoing, started 13:33 UT] | ||||||||||||
| DATE*: [color if science data acquired] |
2012-12-09 SM 11 report | NLT |
2012-12-10 SM 87 report | NLT |
2012-12-11 report | NLT |
2012-12-12 SM 23 report | NLT |
2012-12-13 report | NLT |
2012-12-14 VM 217 report | NLT |
LOST? [may require OB grade review] |
action required? [if not green: take these data types ... |
Setup: ... for these setups] |
||||
|
raw | raw | raw | raw | raw | raw | |||||||
|
|
products | products | ||||||||||
Dates with science data: highlighted in yellow, contain the SM and/or VM flag (total number of science files is displayed).
Dates without science data: grey background, no SM/VM flag.
'report': raw data report (created by QC)
'NLT': night log from nightlog tool (requires login to user portal, password-protected)
The last DATE column has a field on top, indicating the status of daytime calibrations (pending/ongoing/finished). This is relevant for the judgment of missing calibrations for that date: any MISS or NOK in case of "finished" is significant, while otherwise these calibrations are likely to still be in the calOBBuilder queue. Also, this field might be helpful to detect cases when a calibration queue is broken or has been interrupted.
The row labelled Raw CAL displays links to the raw file displays (screenshots). Only the last 7 days have this link. Screenshots for older data are removed. In rare cases this line is labelled "n/a" ("not available"), when an instruments delivers only raw files in bintable format for which screenshots make no sense.
The row labelled Product quality links to the QC-maintained product quality monitor (also called the "AB monitor" where AB stands for association block, the fundamental QC processing job).
The product quality monitor shows the current status of data processing at QC Garching, including quality scores (which are also used on the Health Check monitor) and QC reports. The AB monitor reflects the calibration quality, while the calChecker reflects calibration completeness. Processing of the calibrations by QCG is done automatically and within the hour (data transfer permitting).
The links labelled "Products
quality" are marked ![]() products if
the CALIBs for that date have already been certified by the QC group (to indicate
to PSO that the product quality has been checked and potential issues have already
been raised). Those nights which are not yet certified are marked products .
products if
the CALIBs for that date have already been certified by the QC group (to indicate
to PSO that the product quality has been checked and potential issues have already
been raised). Those nights which are not yet certified are marked products .
An exclamation mark ! products marks nights with data coming in unsupported modes. These data have no products and need a visual check by Paranal daytime astronomers.
The column "action required?" contains types of missing calibrations, and a link to the association rules used. The last Setup column lists the setup of missing calibrations. These two columns contain the necessary information about missing calibrations.
The column "LOST?" contains those types of missing calibrations which are missing and cannot be acquired anymore (see below). They are distinguished from the calibration issues since strictly speaking it is pointless to take them e.g. a night later. Rather the affected science OBs need to be reviewed and perhaps be downgraded. A classical example for LOST calibrations are photometric STD data for imaging modes, which need to be taken the same night as the science data.
| daytime calibs: | [daytime calibrations ongoing, started 13:33 UT] | ||||||||||
| 2013-12-09 SM 11 report | NLT |
2013-12-10 SM 87 report | NLT |
2013-12-11 report | NLT |
2013-12-12 SM 23 report | NLT |
2013-12-13 report | NLT |
2013-12-14 VM 217 report | NLT |
LOST? [may require OB grade review] |
action required? [if not green: take these data types ... |
Setup: ... for these setups] |
|||
| Data type (Mode): | Setup: | ||||||||||
| SCIENCE_IMG | I_BESSEL | |
|
ok |
|
|
LOST | STD | all ok | ||
| SCIENCE_MED | IFU2_L881.7 | |
ok |
|
|
|
all ok | ||||
| Medusa1_L881.7 | ok |
|
|
|
|
nok [not yet analyzed] |
|
Medusa1_L881.7 | |||
| Medusa1_L543.1 | |
|
|
ok |
|
ok |
all ok | ||||
|
Argus_H651.5A
|
|
|
|
|
|
ok |
all ok | ||||
Data types are defined by mode and setup. Each science data type has one row, each date has one column. These two coordinates define a box which is evaluated by the tool as ok, nok or lost/miss:
| ok | available CALIB data are complete and all within the validity time range. |
| nok | available CALIB data are complete but at least one CALIB file type is outdated. New measurement should be done asap. The corresponding CALIB file type is listed in the rightmost column. |
| miss | CALIB data are incomplete, at least one CALIB file type is missing. New measurement should be done asap. Missing files are listed in the rightmost column. |
| LOST | CALIB data are incomplete, a specific CALIB file type is missing which however cannot be measured again (under the same circumstances). The only action to be taken is a review of the science OB grade. LOST file types are listed in the corresponding column. |
Whenever a "missing" calibration is indicated, this is a reminder for obtaining them as soon as possible. Otherwise the corresponding SCIENCE observation may be lost (graded 'C' or 'D').
Old issues. It might happen that an unsolved calibration issue is older than the standard analysis window of 7 days. Classical example is a twilight flat that requires certain conditions which might not be available for a week. Then, the issue (NOK or MISS; not: LOST!) is carried over and displayed for as long as the configured range of the calibration memory. That range is displayed in the right bottom corner. The date with the carried over issue is listed at the left part of the result table, with a slightly different lokup. It remains visible until either the issue is solved or the maximum date range has expired.
| daytime calibs: | finished 09:28UT | ||||||||||||||||||||||||||||||||||||||||||||||||||||||||||||||||||||||||||||||||||||||||||||||||||
| DATE*: [?] [color if science data acquired] |
old
issue 2014-01-18 SM 49 report | NLT |
2014-01-20 SM 84 report | NLT |
2014-01-21 SM 115 report | NLT |
2014-01-22 SM 86 report | NLT |
2014-01-23 SM 127 report | NLT |
2014-01-24 report | NLT |
2014-01-25 report | NLT |
2014-01-26 SM 113 report | NLT |
LOST? [may require OB grade review] |
Calibration
action? [?] [take these data types ... |
Setup: ... for these setups] |
||||||||||||||||||||||||||||||||||||||||||||||||||||||||||||||||||||||||||||||||||||||||
|
raw | raw | raw | raw | raw | raw | |||||||||||||||||||||||||||||||||||||||||||||||||||||||||||||||||||||||||||||||||||||||||||||
|
products | products | products | products | products | ||||||||||||||||||||||||||||||||||||||||||||||||||||||||||||||||||||||||||||||||||||||||||||||
| Data types: | Setup: | ||||||||||||||||||||||||||||||||||||||||||||||||||||||||||||||||||||||||||||||||||||||||||||||||||
|---|---|---|---|---|---|---|---|---|---|---|---|---|---|---|---|---|---|---|---|---|---|---|---|---|---|---|---|---|---|---|---|---|---|---|---|---|---|---|---|---|---|---|---|---|---|---|---|---|---|---|---|---|---|---|---|---|---|---|---|---|---|---|---|---|---|---|---|---|---|---|---|---|---|---|---|---|---|---|---|---|---|---|---|---|---|---|---|---|---|---|---|---|---|---|---|---|---|---|---|
| SCIENCE | H_ALPHA_1_1 | |
|
|
|
|
|
|
nok |
STD | TWILIGHT | H_ALPHA_1_1 | ||||||||||||||||||||||||||||||||||||||||||||||||||||||||||||||||||||||||||||||||||||||||
| NB_659_1_1 | |
ok |
ok |
|
|
|
|
|
all ok | ||||||||||||||||||||||||||||||||||||||||||||||||||||||||||||||||||||||||||||||||||||||||||
| g_SDSS_1_1 | |
ok |
|
ok analyzed: [1] |
ok |
|
|
nok |
STD | TWILIGHT | g_SDSS_1_1 | ||||||||||||||||||||||||||||||||||||||||||||||||||||||||||||||||||||||||||||||||||||||||
| i_SDSS_1_1 | nok analyzed: [2] |
ok |
ok |
LOST analyzed: [3] |
ok analyzed: [4] |
|
|
ok |
STD | TWILIGHT | i_SDSS_1_1 | ||||||||||||||||||||||||||||||||||||||||||||||||||||||||||||||||||||||||||||||||||||||||
| r_SDSS_1_1 | ok |
ok |
ok |
ok analyzed: [5] |
ok |
|
|
nok |
STD | TWILIGHT | r_SDSS_1_1 | ||||||||||||||||||||||||||||||||||||||||||||||||||||||||||||||||||||||||||||||||||||||||
| u_SDSS_1_1 | |
|
|
|
ok |
|
|
|
all ok | ||||||||||||||||||||||||||||||||||||||||||||||||||||||||||||||||||||||||||||||||||||||||||
Analysis notes. Whenever possible, the QC scientist or the Paranal astronomer makes an attempt to analyze a situation with NOK, MISS or LOST. The analysis result is then displayed underneath the result table, as a separate table labeled "Analysis notes". More ...
Detail pages. Click on any of the links in the result boxes, and see detailed results per DATE: every single SCIENCE file is listed with its OB ID, grade and comment, and the details of its associated calibrations, including the time delay and the calChecker flag. These detailed pages are intended to help with the analysis of problems. For instance, they tell you immediately that an OB has been graded C and therefore in principle does not need complete and valid calibrations.
If you don't want to wait for the cronjob tool refresh (done every 30 minutes), you can set a trigger here that launches a forced refresh of the tool on the Garching server within a minute. Provide your email address and follow the tool refresh log under the link provided to you.
Analysis notes are comments about a NOK, MISS or LOST case. Sometimes the automatic assessment by calChecker is inappropriate and can be overridden. A typical example is a missing calibration referring to an OB graded as 'C'. While calChecker flags this as 'MISS' or 'LOST', the correct, analyzed result is 'OK', with a comment like "no issue, OB graded C". The analysis notes are displayed in the corresponding section of the main result table.
As the Garching QC scientist or the Paranal SCIOPS staff, you can provide analysis notes. Use the "analyze ISSUES" link.
You need to authenticate (use the contact link if you do not remember the credentials). The interface offers you all cases currently open for analysis (multiple selection possible). Enter the result, the new grade, your analysis note, and your email. The analysis information will be be taken up by calChecker upon its next scheduled execution. You can also enter a "preliminary comment", meaning the analysis will remain open but the comment appears in the analysis section of the result table.
Here is an example:
![[ top ]](http://www.eso.org/images/arr1red-up.gif "[top]") Mark BADQUAL data
Mark BADQUAL data
Occasionally there are calibrations which satisfy the formal criteria (metadata) for calChecker but are known to have a quality issue. This dialogue hides these calibrations for calChecker, thus flagging a calChecker issue and the need for better calibrations.
Identify the datasets you want to be marked. For logical reasons, only complete datasets (as processed by the pipelines) can be marked. Only the calibrations from today (in the usual calChecker sense) are displayed here.
If you select a dataset, please provide a comment that explains the reason why the dataset should be ignored. There is no need for (and no value in) hiding datasets that are not triggered by the calObBuilder (i.e. that are not triggered by science data).
There are three possible flags: OK is the default (quality OK); BAD is a dataset just marked by you but not yet catched by calChecker; HIDDEN is a bad dataset that is already known to calChecker and has been taken into account.
- For easy navigation you can sort the table columns, or filter by e.g. setup values.
- You can mark multiple datasets at a time if the same comment applies.
- You will find calibration data on the interface from the current date only. Note the convention that a new date starts at 21:00 UT (begin of night on Paranal).
![]() Instrument
information and configuration
Instrument
information and configuration
Below the result table there is additional information about the data types and setups used for the calChecker:
| INFORMATION SPECIFIC TO GIRAFFE |
|---|
| The following keys are used to define a SCIENCE
GIRAFFE setup:
ins.slit.name (= Medusa1/2; IFU1/2; Argus) |
This table contains information on how a setup is defined etc. In the CAL4CAL version, this information applies to the setups of the (triggering) calibrations.
| CONFIGURATION | |
|---|---|
| Number of days scanned: | 7 |
| Range of days for the issue memory (configured): | 20 |
| Range of days for the calibration memory (issue memory plus longest validity): | 27 |
| Days in the calibration&issue memory: | |
| *Date on this monitor changes at: | 21:00 UT |
Number of days scanned: this parameter defines how many days are scanned for science data, starting with the current date. By agreement this is 7 days.
Range of days for the issue memory: this is the range for keeping an issue open. It applies to NOK or MISS issues, not for LOST issues (these are removed after 7 days).
Range of days for the calibration memory: this number defines the depth of the calibration memory, i.e. the number of days scanned for calibration data.
Days in the calibration&issue memory: List of days in the memory.
![]() Long-term
and maintenance calibrations
Long-term
and maintenance calibrations
| Long-term calibrations and maintenance (complete overview) | how to execute) [?] | ||||||||||||||||||||||||||||||||||||||||||||||||||||||||||||||||||||||||||||||||||||||||||||||||||
| type of calibration | validity (days | )age (days) | evaluation | |||||||||||||||||||||||||||||||||||||||||||||||||||||||||||||||||||||||||||||||||||||||||||||||
| DETECTOR_MON | 30 | 22.2 | soft REMINDER: next 9 day(s) | |||||||||||||||||||||||||||||||||||||||||||||||||||||||||||||||||||||||||||||||||||||||||||||||
| ARGUS_STD_EFFIC | 30 | 58.2 | ||||||||||||||||||||||||||||||||||||||||||||||||||||||||||||||||||||||||||||||||||||||||||||||||
Long-term calibrations are maintenance, technical and Health Check
calibrations. Their distinguishing feature is that their acquisition is not driven
by science data but by a maintenance calibration plan. Typically they are taken rarely
(say every month or so), but there exist also cases (often Health Check calibrations)
which are scheduled every week, or even more often. They are monitored on the calChecker in the following way:
- they have a configured validity (e.g. 30 days)
- the last occurrence of each data type is scanned in the raw data reports; the tool iterates backwards in time, to a maximum of one year
- the current age of the last instance is evaluated and flagged as
- OK/green: if it is younger than 70% of the validity
- soft REMINDER/yellow: younger than validity but within 30%; recommended action: refresh on next occasion
- REMINDER/yellow: outdated but by not more than 30%; recommended action: refresh on next occasion
- REMINDER/red: outdated by more than 30%, refresh as soon as possible
All cases (if any) which flag yellow or red are displayed in the summary table on the main calChecker page. So these are the ones where some action needs to be taken.
The complete overview is available behind the link "complete overview here". As an example, you may want to inspect the GIRAFFE case. It lists:
- the tag defining the type of calibration (e.g. DETECTOR_MON for the detector monitoring sequence), and a description of what that means; that description is meant to be specific enough to identify clearly the particular data set. It may contain the template name, a set of DPR keys etc.the validity and age in days
- a slightly more extensive version of the recommended action
The link how to execute points to a page with information related to the execution of the corresponding templates and OBs. The content is provided by the Paranal instrument scientist.
The long-term calibration monitor is implemented by scanning the raw data reports (the ones which are linked to the calibration completeness monitor as report ). Scanning starts with the current date and goes backwards month by month, up to a full year. The first raw file matching the selection criteria will be evaluated in terms of age and validity.
There is no check for quality, nor for correctness of the header entries.
![]() CAL4CAL
checks and tellTracker link
CAL4CAL
checks and tellTracker link
|
Science and CAL4CAL checks
|
|||
| |
|
If both tabs are enabled, calChecker for
this instrument is configured for science checks and for CAL4CAL checks
(calibrations for calibrations). It comes with two main result pages.
|
|
| no cal4cal |
If only the 'science' tab is enabled,
this instrument is not configured for CAL4CAL checks
(because they make no sense here).
|
||
For instruments configured for CAL4CAL checks, there are two main result pages instead of one, both are identical in format. The difference is the content. For the normal calChecker page the science data are used to trigger checks for calibration completeness. For the CAL4CAL result page, certain calibrations trigger those checks (hence 'calibrations for calibrations' or CAL4CAL for short). Classical example are standard stars which require their own set of calibrations, this set not being covered by the normal checks. Another example are IR twilight flats which may require darks in setups (DIT_NDIT combinations) which are different from the ones needed for science. We call these calibrations 'triggering calibrations' while the DARKs or FLATs are 'dependent calibrations'.
The CAL4CAL output format and colour-coding is identical to the one for science data. The CAL4CAL part of calChecker has its own configuration, ASSOC-RULES, NEWS file and ANALYSIS section.
Important: There is no logical link between the CAL4CAL part and the science part. This means, if a calibration for a triggering calibration is flagged MISS on the CAL4CAL page, and if that triggering calibration is required for science, the corresponding box for the science file is not marked as MISS. Hence, you need to always check both pages independently. If the science page displays only OKs but the CAL4CAL page has found an issue, it might be true that this issue indirectly affects also the science data. (It is simply not possible to transfer that information from the CAL4CAL page to the science page for all possible cases.)
| |
If an issue has been found (a NOK or MISS result), the CAL4CAL navigation tab is marked by an exclamation mark ' !'. If there is no such flag, you can be sure that there are no issues on the CAL4CAL page.
|
tellTracker link
|
|||||
| science | |
tellTracker |
A few instruments have a third module
of calChecker enabled, called tellTracker.
|
||
The tellTracker is designed to follow up time-critical nighttime calibrations, like the telluric standard stars. Find more information about tellTracker here.
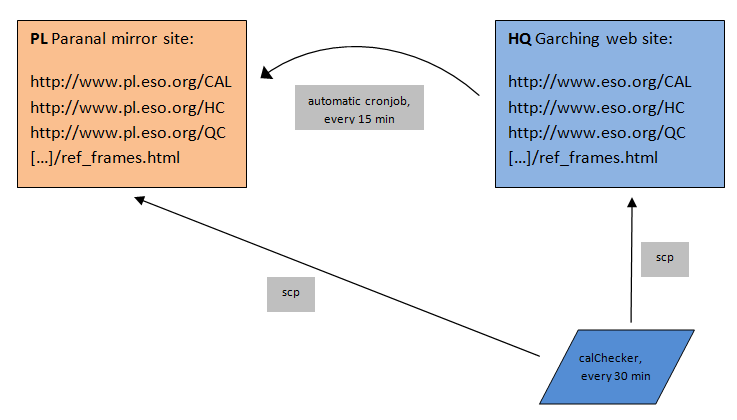
In order to provide a better viewing experience on Paranal, the calChecker mirror site http://www.pl.eso.org/observing/dfo/quality/ALL/daily_cal.html is maintained. The following scheme is currently installed:
- All calChecker pages from www.eso.org are replicated to www.pl.eso.org by an automatic rsync every 15 minutes.
- The main pages http://www.eso.org/observing/dfo/quality/<instr>/reports/CAL/calChecker_<instr>.html (like http://www.pl.eso.org/observing/dfo/quality/GIRAFFE/reports/CAL/calChecker_GIRAFFE.html) and their CAL4CAL counterpart are also directly copied to the Paranal mirror, to provide maximum up-to-dateness.
- The pages with the details (information per day and per setup) are served from the internal QC web server http://qcweb.hq.eso.org and are not replicated.
- The analysis php page remains on www.eso.org.
- The Paranal mirror (PL) is visible ESO internal only, as is the QC web server qcweb. The Garching web server (HQ) is public.
The related pages from the HC monitor, the reference pages and the QC pages are also replicated every 15 minutes.
Pages on the Paranal mirror site are recognized by the vertical logo ![]() .
.
Switch between the two sites using the link close to the logo: mirror sites: PL (internal link) HQ