AMBER trending system: HEALTH CHECK report
Last update: 2018-09-17T09:40:51 (UT)
[enable javascript for displaying time difference!]
General news:
NOTE: The Health Check and calChecker services have been moved to qcFlow. These pages are only maintained for comparison
and will be removed in 2026.
AMBER news:
2018-09-06 Last data taken with AMBER.
Report news:
Plot? Symb? Source Average ? Thresholds ? N_ QC1 Data Remarks
method value unit method value
1
• QC1DB MEDIAN 0.815 NONE VAL 0.65,1 2 meas_int_Vis_base12
this |
last_yr |
all
2
• QC1DB MEDIAN 0.896 NONE VAL 0.65,1 2 meas_int_Vis_base23
this |
last_yr |
all
VIS23_for_HK2.172
3
• QC1DB MEDIAN 0.755 NONE VAL 0.65,1 2 meas_int_Vis_base31
this |
last_yr |
all
VIS31_for_HK2.172
4
• QC1DB MEDIAN NONE VAL 0.65,1 0 int_Vis_K_base12
this |
last_yr |
all
VIS12_for_HK2.288
5
• QC1DB MEDIAN NONE VAL 0.65,1 0 int_Vis_K_base23
this |
last_yr |
all
VIS23_for_HK2.288
6
• QC1DB MEDIAN NONE VAL 0.65,1 0 int_Vis_K_base31
this |
last_yr |
all
VIS31_for_HK2.288
7
• QC1DB MEDIAN NONE VAL 0.65,1 0 int_Vis_K_base12
this |
last_yr |
all
VIS12_for_HK2.056
8
• QC1DB MEDIAN NONE VAL 0.65,1 0 int_Vis_K_base23
this |
last_yr |
all
VIS23_for_HK2.056
9
• QC1DB MEDIAN NONE VAL 0.65,1 0 int_Vis_K_base31
this |
last_yr |
all
VIS31_for_HK2.056
*Data sources: QC1DB: QC1 database; LOCAL: local data source
Plot 1 scores: not implemented
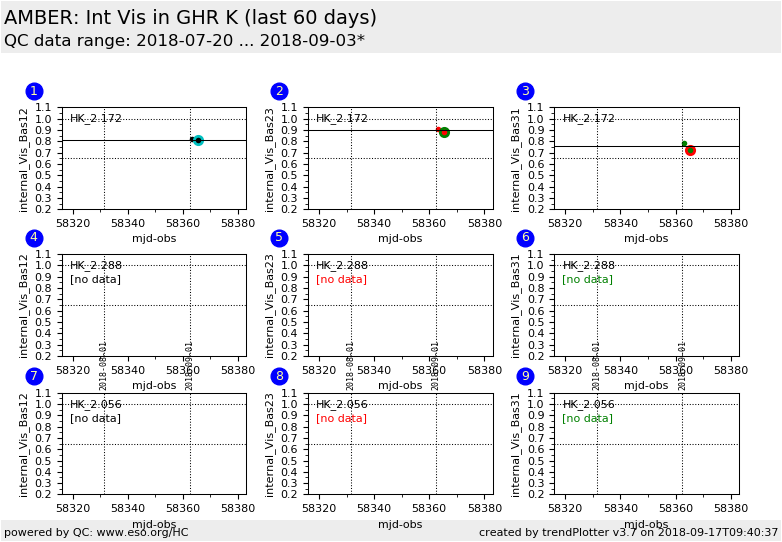
data source: amber_p2vm dataset: meas_int_Vis_base12 • median: 0.815 NONE fixed thresholds: 0.65...1 NONE N_data plotted: 2 [click plot for closeup]
Plot 2 scores: not implemented
data source: amber_p2vm dataset: meas_int_Vis_base23 • median: 0.896 NONE fixed thresholds: 0.65...1 NONE N_data plotted: 2 [click plot for closeup]
Plot 3 scores: not implemented
data source: amber_p2vm dataset: meas_int_Vis_base31 • median: 0.755 NONE fixed thresholds: 0.65...1 NONE N_data plotted: 2 [click plot for closeup]
Plot 4 scores: not implemented
data source: amber_p2vm dataset: int_Vis_K_base12 • median: no data NONE fixed thresholds: 0.65...1 NONE N_data plotted: 0 [click plot for closeup]
Plot 5 scores: not implemented
data source: amber_p2vm dataset: int_Vis_K_base23 • median: no data NONE fixed thresholds: 0.65...1 NONE N_data plotted: 0 [click plot for closeup]
Plot 6 scores: not implemented
data source: amber_p2vm dataset: int_Vis_K_base31 • median: no data NONE fixed thresholds: 0.65...1 NONE N_data plotted: 0 [click plot for closeup]
Plot 7 scores: not implemented
data source: amber_p2vm dataset: int_Vis_K_base12 • median: no data NONE fixed thresholds: 0.65...1 NONE N_data plotted: 0 [click plot for closeup]
Plot 8 scores: not implemented
data source: amber_p2vm dataset: int_Vis_K_base23 • median: no data NONE fixed thresholds: 0.65...1 NONE N_data plotted: 0 [click plot for closeup]
Plot 9 scores: not implemented
data source: amber_p2vm dataset: int_Vis_K_base31 • median: no data NONE fixed thresholds: 0.65...1 NONE N_data plotted: 0 [click plot for closeup]
This plot
The P2VM (Pixel to Visibility Matrix) is used to calibrate the science data. The pipeline product provides also some QC parameters which are used to monitor the Instrumental transfer function and the offset between the photometric beams.
General information
Click on any of the plots to see a close-up version .
The latest date is indicated on top of the plot.
If configured,
data points belonging to the latest date are specially marked statistical averages are indicated by a solid line, and thresholds by broken lines outliers are marked by a red asterisk. They are defined as data points outside the
threshold lines "aliens" (= data points outside the plot Y limits) are marked by a red arrow (↑ ↓ you can download the data for each parameter set if the 'Data downloads' link shows up
