mirror sites: PL (internal link) HQ     [?]

Health Check monitor


CAL | HC | refs | QC
HealthCheck Monitor
   HOME | UsersGuide
  sl icon ALL INSTRUMENTS
 
all KPI reports
AMBER
P2VM temperature
Other HC:
QC links:
        [page auto-refreshes after 300 sec]   [stop | on]            [press Ctrl+Shift+R to enforce refresh of scores, dates and news]
AMBER trending system: HEALTH CHECK report
HELP USERS-GUIDE MORE
Last update: 2018-09-17T09:45:52 (UT)
  | now: 2024-05-05T10:27:45 (UT) muc05 QC pipeline: amber-4.3.8 (installed 2018-05-15)
same group: IntVis_temp
General news: NOTE: The Health Check and calChecker services are moved to qcFlow on an instrument by instrument basis. The current pages will not be updated any longer once the move has been finished.
AMBER news: 2018-09-06 Last data taken with AMBER.
Report news:
DATE*: [?] 2018-09-10
no data | NLT
2018-09-11
no data | NLT
2018-09-12
no data | NLT
2018-09-13
no data | NLT
2018-09-14
no data | NLT
2018-09-15
no data | NLT
2018-09-16
no data | NLT
r...
Raw CAL displays:
no CAL raw files no CAL raw files no CAL raw files no CAL raw files no CAL raw files no CAL raw files no CAL raw files
P...
CAL product quality:
no CAL products no CAL products no CAL products no CAL products no CAL products no CAL products no CAL products
 
transfer   ngas [?]

scores&comments | FULL | history ... | plot tutorial ... | contact | HC_docu...               [?]
*Date on this monitor changes at 21:00 UT
png: Information and research:
- png file
Plot
?
Symb
?
Source
*
Average ? Thresholds ? N_
data
QC1
parameter
Data
downloads
Remarks
method value unit method value
1 LOCAL none   NONE none  43 bas12 n/a VIS12
2 LOCAL none   NONE none  43 bas23 n/a VIS23
3 LOCAL none   NONE none  43 bas31 n/a VIS31
4 LOCAL MEDIAN   NONE VAL11,17 0 temp temp in VLTI lab (CAU)
4 LOCAL MEDIAN   NONE VAL11,17 0 temp  
*Data sources: QC1DB: QC1 database; LOCAL: local data source
Plot 1
scores: not implemented
data source:local data source
dataset:bas12
average:none
thresholds:none
N_data plotted:43
[click plot for closeup]
Plot 2
scores: not implemented
data source:local data source
dataset:bas23
average:none
thresholds:none
N_data plotted:43
[click plot for closeup]
Plot 3
scores: not implemented
data source:local data source
dataset:bas31
average:none
thresholds:none
N_data plotted:43
[click plot for closeup]
Plot 4
scores: not implemented
data source:local data source
dataset:
(numbers below apply to this dataset)
temp
median:no dataNONE
fixed thresholds:11...17NONE
N_data plotted:0
[click plot for closeup]
This plot


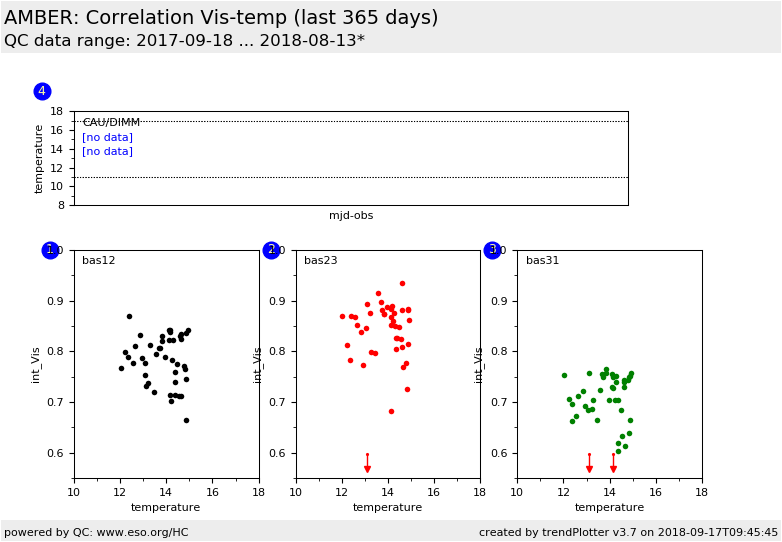
The HC plots "temp" and "IntVis_temp" are long range plots to see if there are correlations between the Internal Visibility and the temperature measured at the CAU. The DIMM temperature is also displayed.  


General information

Click on any of the plots to see a close-up version.

The latest date is indicated on top of the plot.

If configured,

  • data points belonging to the latest date are specially marked
  • statistical averages are indicated by a solid line, and thresholds by broken lines
  • outliers are marked by a red asterisk. They are defined as data points outside the threshold lines
  • "aliens" (= data points outside the plot Y limits) are marked by a red arrow ( or )
  • you can download the data for each parameter set if the 'Data downloads' link shows up