AMBER trending system: HEALTH CHECK report
Last update: 2018-09-17T09:46:33 (UT)
[enable javascript for displaying time difference!]
General news:
NOTE: The Health Check and calChecker services have been moved to qcFlow. These pages are only maintained for comparison
and will be removed in 2026.
AMBER news:
2018-09-06 Last data taken with AMBER.
Report news:
png: Information and research:
- png file
- advanced studies:
QC1 browser |
QC1 plotter
Plot? Symb? Source Average ? Thresholds ? N_ QC1 Data Remarks
method value unit method value
1
• QC1DB MEDIAN 0 NONE VAL 0,1 123 null_frames
this |
last_yr |
all
Low_JHK
2
• QC1DB MEDIAN 0 NONE VAL 0,18 2 null_frames
this |
last_yr |
all
High_K_2.172
2
• QC1DB MEDIAN NONE VAL 0,18 0 null_frames
this |
last_yr |
all
High_K_2.056
2
• QC1DB MEDIAN NONE VAL 0,18 0 null_frames
this |
last_yr |
all
High_K_2.288
2
• QC1DB MEDIAN NONE VAL 0,18 0 null_frames
this |
last_yr |
all
High_K_2.133
2
• QC1DB MEDIAN 0 NONE VAL 0,18 2 null_frames
this |
last_yr |
all
High_K_2.211
2
• QC1DB MEDIAN NONE VAL 0,18 0 null_frames
this |
last_yr |
all
High_K_2.249
2
• QC1DB MEDIAN NONE VAL 0,18 0 null_frames
this |
last_yr |
all
High_K_2.326
3
• QC1DB MEDIAN 0 NONE VAL 0,18 4 null_frames
this |
last_yr |
all
Medium_K_2.1
3
• QC1DB MEDIAN NONE VAL 0,18 0 null_frames
this |
last_yr |
all
Medium_K_2.3
4
• QC1DB MEDIAN NONE VAL 0,18 0 null_frames
this |
last_yr |
all
Medium_H_1_1.65
*Data sources: QC1DB: QC1 database; LOCAL: local data source
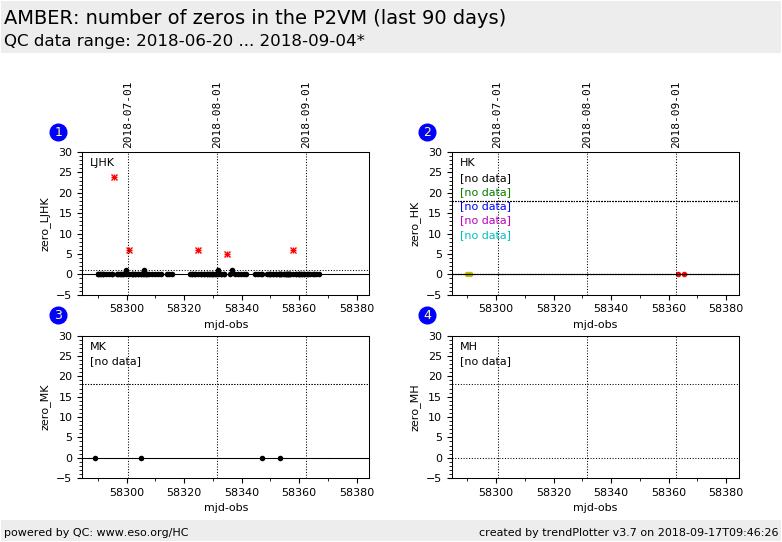
Plot 1 scores: not implemented
data source: amber_p2vm dataset: null_frames • median: 0 NONE fixed thresholds: 0...1 NONE N_data plotted: 123 [click plot for closeup]
Plot 2 scores: not implemented
data source: amber_p2vm dataset: null_frames • median: 0 NONE fixed thresholds: 0...18 NONE N_data plotted: 2 [click plot for closeup]
Plot 3 scores: not implemented
data source: amber_p2vm dataset: null_frames • median: 0 NONE fixed thresholds: 0...18 NONE N_data plotted: 4 [click plot for closeup]
Plot 4 scores: not implemented
data source: amber_p2vm dataset: null_frames • median: no data NONE fixed thresholds: 0...18 NONE N_data plotted: 0 [click plot for closeup]
General information
Click on any of the plots to see a close-up version .
The latest date is indicated on top of the plot.
If configured,
data points belonging to the latest date are specially marked statistical averages are indicated by a solid line, and thresholds by broken lines outliers are marked by a red asterisk. They are defined as data points outside the
threshold lines "aliens" (= data points outside the plot Y limits) are marked by a red arrow (↑ ↓ you can download the data for each parameter set if the 'Data downloads' link shows up
