NOTE: The Health Check and calChecker services are moved to qcFlow on an instrument by instrument basis. The current pages will not be updated any longer once the move has been finished.
One of the IOT project is to monitor the throughput of the AMBER
instrument.
GROUP "flux_magnitude":
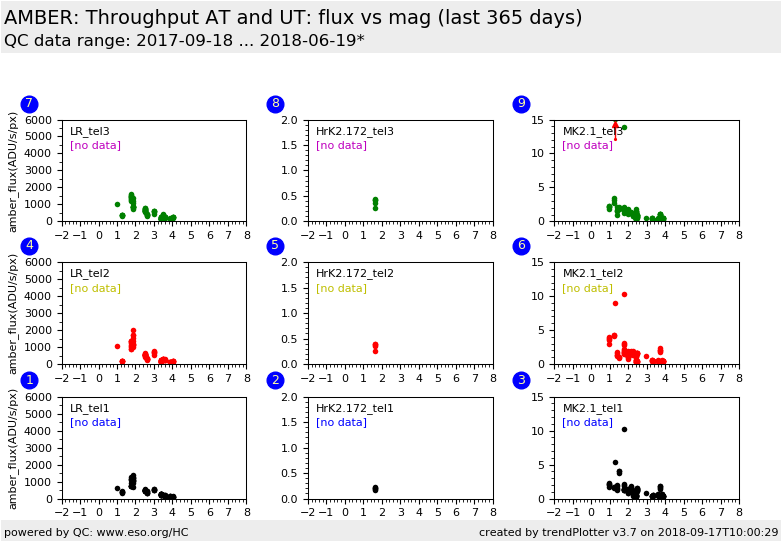
The pipeline calculates a QC parameter which corresponds to the total flux in
the central 80% of the spectrum (J H or K) for the different photometric
channels P1 P2 P3. These values are given in e-
They are afterwards corrected in ADU/s/px (gain used: 4.7)
This is not corrected for the magnitude and the transmission of the VLTI.
The AMBER flux is shown as a function of the K/H magnitude (extracted from
the calibrator databasexi or from SIMBAD) in this group of plots.
There are several plots:
-- flux_mag_AT/UT: for the ATs (groups 1-2) and UTs (groups 3-4): we plot flux=f(mag) for LRK, MK (2.1 and 2.3), MH, HK (2.172, 2.288)
-- Last groups: flux_mag_tel: we show on the same plot the data for the ATs and UTs for the 3 beams for LK, MK (2.1) and HK (2.172)
GROUP "flux_magnitude_FNT":
A corrected AMBER flux in the
interferometric channels (per
ADU/s/pixel) is calculated by an additional script.
This is not corrected for the magnitude of the object and for the transmission of the VLTI.
The AMBER flux is shown as a function of the K/H magnitude (extracted from
SIMBAD) in this group of plots.
There are several plots:
-- flux_mag_AT/UT: for the ATs (groups 1-2) and UTs (groups 3-4): we plot flux=f(mag) for LRK, MK (2.1 and 2.3), MH, HK (2.172, 2.288)
-- Last groups: flux_mag_tel: we show on the same plot the data for the ATs and UTs for the 3 beams for LK, MK (2.1) and HK (2.172)
GROUP "Throughput":
The pipeline calculates a QC parameter which corresponds
to the total flux in
the central 80% of the spectrum (J H or K) for the different photometric
channels P1 P2 P3. These values are given in e-
They are afterwards corrected in ADU/s/px (gain used: 4.7) and for the
magnitude of the object (from SIMBAD or the calibrator data base)
This is not corrected for the transmission of the VLTI.
The AMBER corrected flux is trended in time for each telescope (AT1 to AT4 and
UT1 to UT4) for the 2 settings LR and HR 2.172
Additional parameters (such as for ex. transmission and magnitude)
are available in the amber_performances qc1database General information
Click on any of the plots to see a close-up version.
The latest date is indicated on top of the plot.
If configured,
data points belonging to the latest date are specially marked
statistical averages are indicated by a solid line, and thresholds by broken lines
outliers are marked by a red asterisk. They are defined as data points outside the
threshold lines
"aliens" (= data points outside the plot Y limits) are marked by a red arrow (↑ or ↓)
you can download the data for each parameter set if the 'Data downloads' link shows up
