Quality Control and
Data Processing
|
ESPRESSO: Fabry-Perot wavelength-calibration frames
Three different calibration sources can be used in order to wavelength calibrate ESPRESSO observations: a Fabry-Perot (FP) cavity, ThAr arc lamps, and a laser-frequency comb (LFC). The Fabry-Perot provides more than 60000 lines which are evenly distributed over the entire wavelength range of ESPRESSO. These give a very accurate relative calibration; the absolute wavelength scale has to be determined with ThAr exposures. The LFC on the other hand gives very accurate relative and absolute calibration. It covers, however, not the complete wavelength range of ESPRESSO. A complete wavelength calibration sequence consists of:
 Counts and saturation check
The maximum number of counts is trended separately for both detectors and for the five different combinations of resolving power and binning: HR with 1x1 and 2x1 binning, UHR with 1x1 binning, and MR with 4x2 and 8x4 binning. Scoring&thresholds Counts and saturation check The upper limit has been set to 60000 ADU which is slightly below the saturation limit of 65535 ADU. The lower limit is at 20000 ADU which represents the accepted range in early operations. Data taken before October 2018 have been processed with a pipeline version that converted ADUs into electrons (with about 1.1 e-/ADU). Algorithm Counts and saturation check Pipeline calculates values per read-out port. The QC script uses these values to determine the maximum for each of the chips. Formally, pipeline values come per output file, one for fibre A and one for fibre B. In both cases, the reported number of counts refers to the same raw file. Therefore, the counts for fibre A and B are identical and only the QC parameter for fibre A is plotted.
Number of FP lines
The number of Fabry-Perot lines used for wavelength calibration after calibrating them with ThAr lines.
The number of FP lines is trended separately for fibres A and B and for the five different combinations of resolving power and binning: HR with 1x1 and 2x1 binning, UHR with 1x1 binning, and MR with 4x2 and 8x4 binning. In addition to the total number of lines for the blue plus the red chip, the average number per order, and the RMS of the numbers of the individual orders are trended. Scoring&thresholds Number of FP lines Scoring and thresholds have been set for the total number of lines using data acquired during commissioning. No particular events. The pipeline calculates the number of FP lines for each order and the total number for all orders (blue+red chip) together.
Radial velocity drift
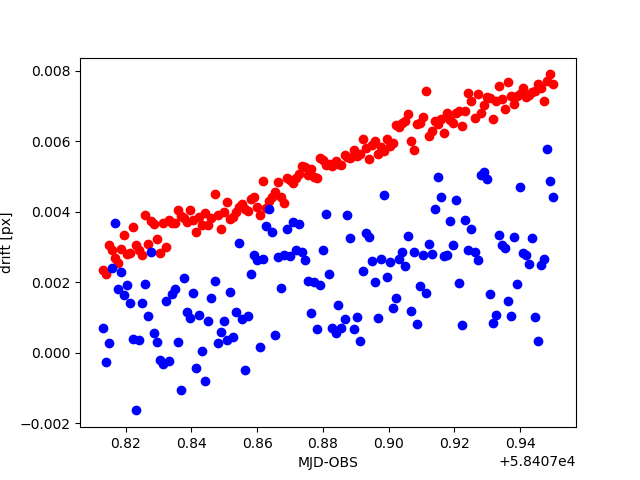
The Fabry-Perot wavelength calibrations can be used to determine the shift of the wavelength scale with respect to a reference. Dedicated sets of ThAr+FP and FP+ThAr exposures with 1x1 and 2x1 binning are measured each afternoon for this purpose. They are pipeline-processed using an appropriate FP+FP exposure from the morning calibrations as reference. The result is a shift in pixels, typically of the order of a few 1E-3 pixels. The figure below shows results from a dedicated measurement using 150 Thar+FP exposures taken from 2018-10-16T19:30 to 2018-10-16T22:48 (HR, 1x1 binning). They have been compared to a FP+FP calibration taken at 2018-10-16T17:53. The measurements in the blue arm show a larger scatter of about +/- 2.0E-03 pixels whereas in the red arm the scatter is about +/- 0.5E-03 pixels. The drift that can be observed over the measurement sequence corresponds to approximately 1.0E-03 pixels/hour in the blue and 2.0E-03 pixels/hour in the red.
The pipeline results are converted into a radial velocity drift per hour, i.e. in cm/s/h. Both the original shift in pixels and the drift are plotted. Scoring&thresholds Radial velocity drift Scoring is not yet implemented. No particular events. Algorithm Radial velocity drift The pipeline calculates the shift in pixels. These values are then converted into a radial velocity drift in cm/s/h: 0.002 pixels correspond to 1 m/s.
|
|||||||||||||||||||||||||||||||||||||||||||||||||||||||||||||||||||||||||||||||||||||||||||||||||||||||||||||||||||||||||||||||||||||||||||||||||||||||||||||||||||||||||||||||||||||||||||||||||||||||||||||||||||||||||||||||||||||||||||||||||||||||||||||||||||||||||||||||||||||||||||||||||||||||||||||||||||||||||||||||||||||||||||||||||||||||||||||||||||||||||||||||||||||||||||||||||||||||||||||||||||||||||||||||||||||||||||||||||||||||||||||||||||||||||||||||||||||||||||||||||||||||||||||||||||||||||||||||||||||||||||||||||||||||||||||
| |
||||||||||||||||||||||||||||||||||||||||||||||||||||||||||||||||||||||||||||||||||||||||||||||||||||||||||||||||||||||||||||||||||||||||||||||||||||||||||||||||||||||||||||||||||||||||||||||||||||||||||||||||||||||||||||||||||||||||||||||||||||||||||||||||||||||||||||||||||||||||||||||||||||||||||||||||||||||||||||||||||||||||||||||||||||||||||||||||||||||||||||||||||||||||||||||||||||||||||||||||||||||||||||||||||||||||||||||||||||||||||||||||||||||||||||||||||||||||||||||||||||||||||||||||||||||||||||||||||||||||||||||||||||||||||||||
 |
|
|||||||||||||||||||||||||||||||||||||||||||||||||||||||||||||||||||||||||||||||||||||||||||||||||||||||||||||||||||||||||||||||||||||||||||||||||||||||||||||||||||||||||||||||||||||||||||||||||||||||||||||||||||||||||||||||||||||||||||||||||||||||||||||||||||||||||||||||||||||||||||||||||||||||||||||||||||||||||||||||||||||||||||||||||||||||||||||||||||||||||||||||||||||||||||||||||||||||||||||||||||||||||||||||||||||||||||||||||||||||||||||||||||||||||||||||||||||||||||||||||||||||||||||||||||||||||||||||||||||||||||||||||||||||||||||