Plot
? |
Symb
? |
Source
* |
Average ? |
Thresholds ? |
N_
data |
QC1
parameter |
Data
downloads |
Remarks |
| method |
value |
unit |
method |
value |
| 1 |
• | QC1DB |
none |
|
ADU |
VAL | 0,0.5 |
79 |
pattern |
this |
last_yr |
all
|
Chip 1, 100Kps/2ports/high_gain, 2x2 |
| 2 |
• | QC1DB |
none |
|
ADU |
VAL | 0,0.5 |
79 |
pattern |
this |
last_yr |
all
|
Chip 2, 100Kps/2ports/high_gain, 2x2 |
| 3 |
• | QC1DB |
none |
|
ADU |
VAL | 0,0.3 |
78 |
pattern |
this |
last_yr |
all
|
Chip 1, 200Kps/2ports/low_gain, 2x2 |
| 4 |
• | QC1DB |
none |
|
ADU |
VAL | 0,0.2 |
78 |
pattern |
this |
last_yr |
all
|
Chip 2, 200Kps/2ports/low_gain, 2x2 |
| |
|
*Data sources: QC1DB: QC1 database; LOCAL: local data source
|
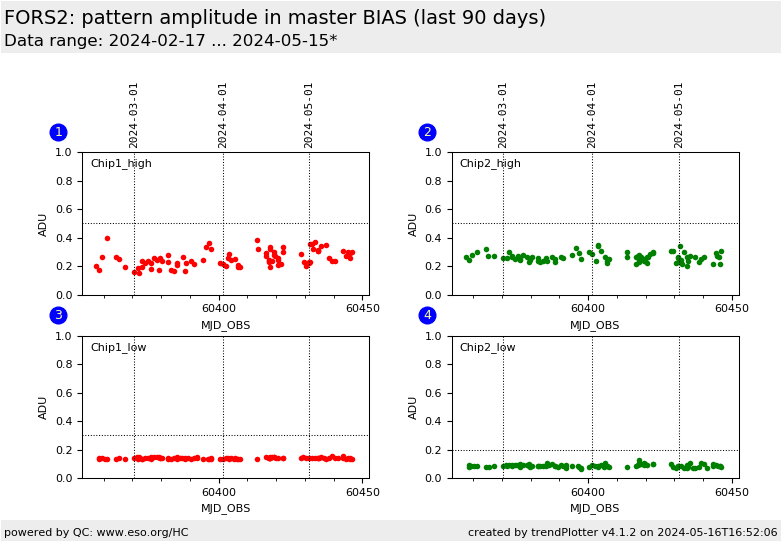
Plot 1
scores:  10| 10|
| | data source: | fors2_bias
(QC1 database) |
| dataset: | pattern | • |
| average: | none |
| fixed thresholds: | 0...0.5 | ADU |
| N_data plotted: | 79 |
| [click plot for closeup] |
Plot 2
scores: 10|
| | data source: | fors2_bias
(QC1 database) |
| dataset: | pattern | • |
| average: | none |
| fixed thresholds: | 0...0.5 | ADU |
| N_data plotted: | 79 |
| [click plot for closeup] |
Plot 3
scores: 6|
| | data source: | fors2_bias
(QC1 database) |
| dataset: | pattern | • |
| average: | none |
| fixed thresholds: | 0...0.3 | ADU |
| N_data plotted: | 78 |
| [click plot for closeup] |
Plot 4
scores: 6|
| | data source: | fors2_bias
(QC1 database) |
| dataset: | pattern | • |
| average: | none |
| fixed thresholds: | 0...0.2 | ADU |
| N_data plotted: | 78 |
| [click plot for closeup] |
The master bias is averaged along its columns. Then the rms of the
resulting 1-dimensional frame is used to check for the presence of a
bias pattern (predominantly in low gain, 2x2 readout) Details can be
found in the plot
tutorial.
DB Name: fors2_bias
TPL.ID: img_cal_bias
Fits header keyword: NA, calculated by the QC script
QC1 DB parameter: pattern
General information
Click on any of the plots to see a close-up version.
The latest date is indicated on top of the plot.
If configured,
- data points belonging to the latest date are specially marked
- statistical averages are indicated by a solid line, and thresholds by broken lines
- outliers are marked by a red asterisk. They are defined as data points outside the
threshold lines
- "aliens" (= data points outside the plot Y limits) are marked by a red arrow (↑ or ↓)
- you can download the data for each parameter set if the 'Data downloads' link shows up
|
