Plot
? |
Symb
? |
Source
* |
Average ? |
Thresholds ? |
N_
data |
QC1
parameter |
Data
downloads |
Remarks |
| method |
value |
unit |
method |
value |
| 1 |
• | QC1DB |
MEDIAN |
0.0112 |
NONE |
VAL | 0.0105,0.012 |
23 |
FPN_rel |
this |
last_yr |
all
|
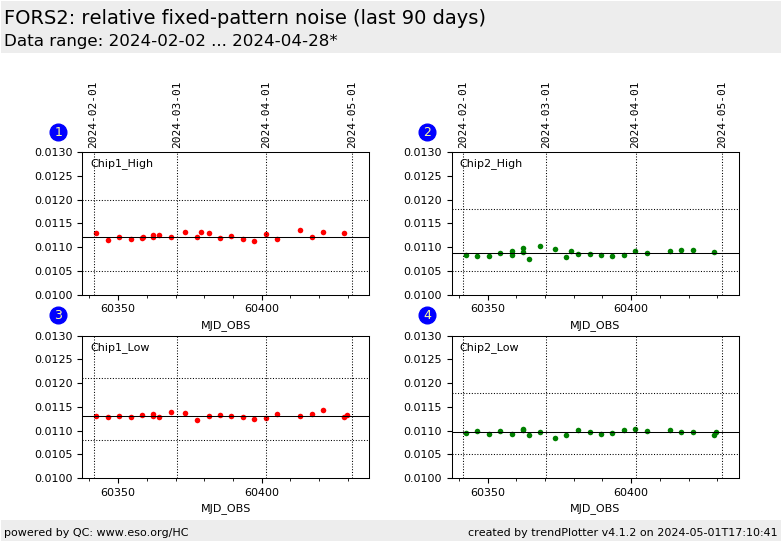
normalized fixed-pattern noise for chip 1, high gain |
| 2 |
• | QC1DB |
MEDIAN |
0.0109 |
NONE |
VAL | 0.0105,0.0118 |
23 |
FPN_rel |
this |
last_yr |
all
|
normalized fixed-pattern noise for chip 2, high gain |
| 3 |
• | QC1DB |
MEDIAN |
0.0113 |
NONE |
VAL | 0.0108,0.0121 |
23 |
FPN_rel |
this |
last_yr |
all
|
normalized fixed-pattern noise for chip 1, low gain |
| 4 |
• | QC1DB |
MEDIAN |
0.0109 |
NONE |
VAL | 0.0105,0.0118 |
23 |
FPN_rel |
this |
last_yr |
all
|
normalized fixed-pattern noise for chip 2, low gain |
| |
|
*Data sources: QC1DB: QC1 database; LOCAL: local data source
|
Plot 1
scores:  2| 2|
| | data source: | fors2_scrflat
(QC1 database) |
| dataset: | FPN_rel | • |
| median: | 0.0112 | NONE |
| fixed thresholds: | 0.0105...0.012 | NONE |
| N_data plotted: | 23 |
| [click plot for closeup] |
Plot 2
scores: 2|
| | data source: | fors2_scrflat
(QC1 database) |
| dataset: | FPN_rel | • |
| median: | 0.0109 | NONE |
| fixed thresholds: | 0.0105...0.0118 | NONE |
| N_data plotted: | 23 |
| [click plot for closeup] |
Plot 3
scores: 2|
| | data source: | fors2_scrflat
(QC1 database) |
| dataset: | FPN_rel | • |
| median: | 0.0113 | NONE |
| fixed thresholds: | 0.0108...0.0121 | NONE |
| N_data plotted: | 23 |
| [click plot for closeup] |
Plot 4
scores: 2|
| | data source: | fors2_scrflat
(QC1 database) |
| dataset: | FPN_rel | • |
| median: | 0.0109 | NONE |
| fixed thresholds: | 0.0105...0.0118 | NONE |
| N_data plotted: | 23 |
| [click plot for closeup] |
The fixed-pattern noise is computed in the following way: The
difference of two 100x100 sub-frames of the same master flat field
image is determined. These two sub-frames are are shifted with respect
to each other by 10 pixels in X- and Y-direction. The population
standard deviation of the difference frame, divided by the square root
of 2, minus the photon noise (geometrically subtracted) yields the
fixed-pattern noise, which is then divided by the median of the
respective region.
More information can be found on
the plot tutorial page
General information
Click on any of the plots to see a close-up version.
The latest date is indicated on top of the plot.
If configured,
- data points belonging to the latest date are specially marked
- statistical averages are indicated by a solid line, and thresholds by broken lines
- outliers are marked by a red asterisk. They are defined as data points outside the
threshold lines
- "aliens" (= data points outside the plot Y limits) are marked by a red arrow (↑ or ↓)
- you can download the data for each parameter set if the 'Data downloads' link shows up
|
