Quality Control and
Data Processing
|
FORS2: Detector monitoring
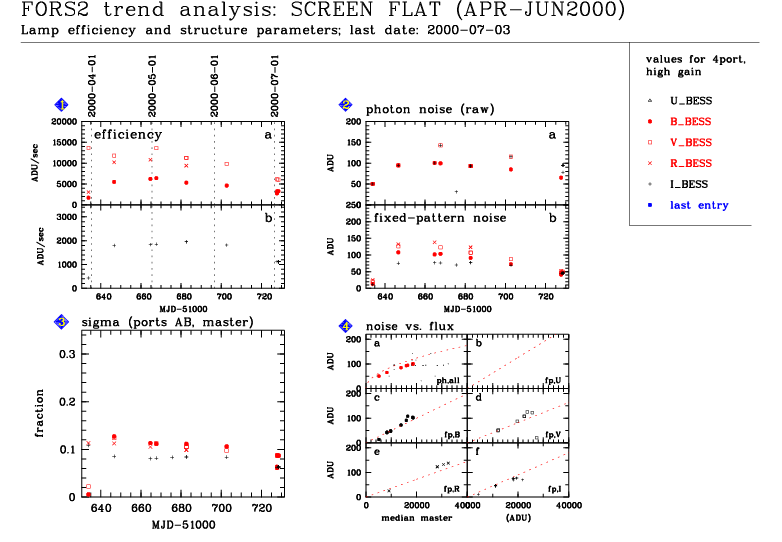
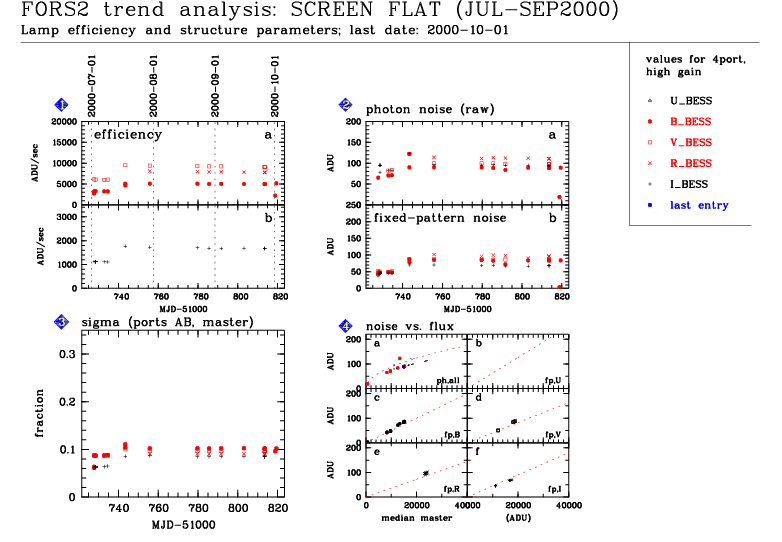
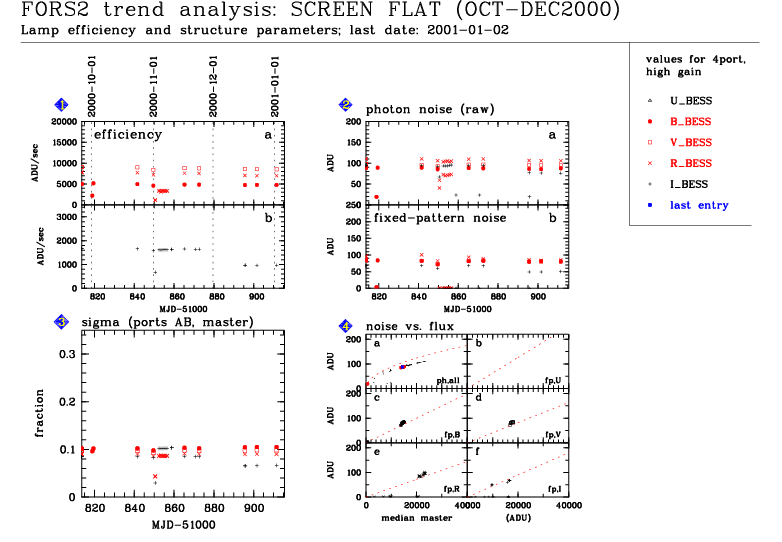
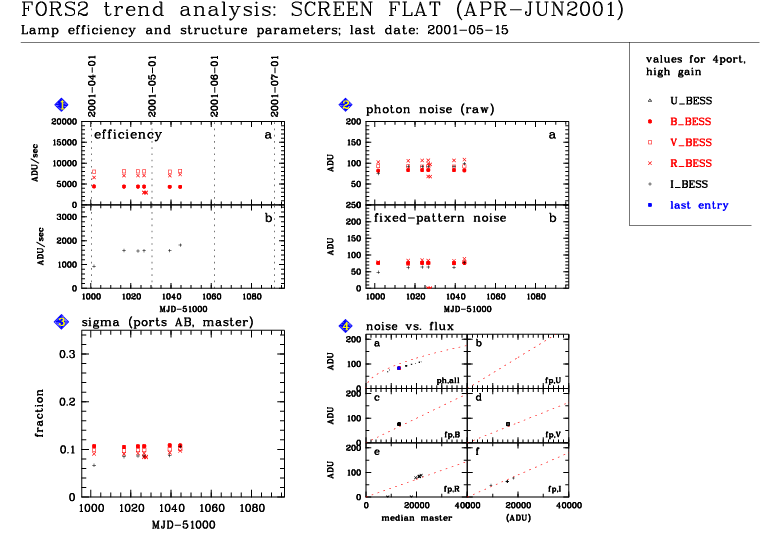
Parameters are measured for the 5 standard filters BVI Bessell and UR_SPECIAL FORS2 screen flats, and for the standard CCD modes (100Kps/high_gain/2x2 and 200Kps/low_gain/2x2).  Conversion Factor
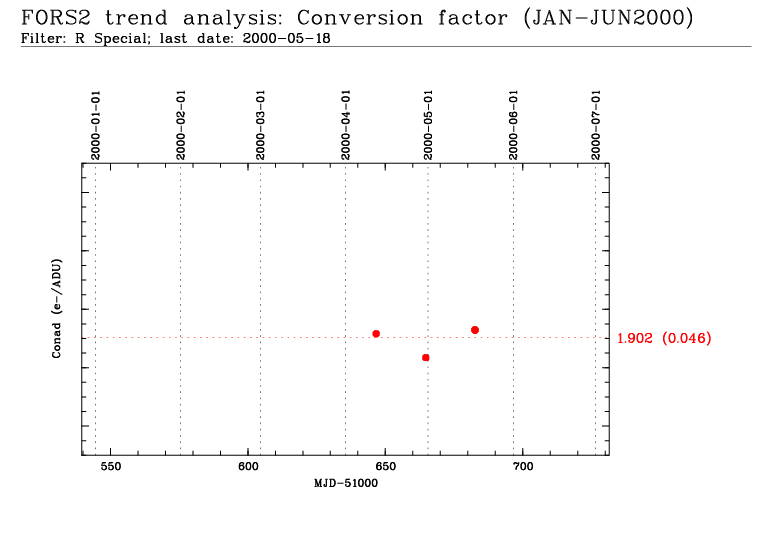
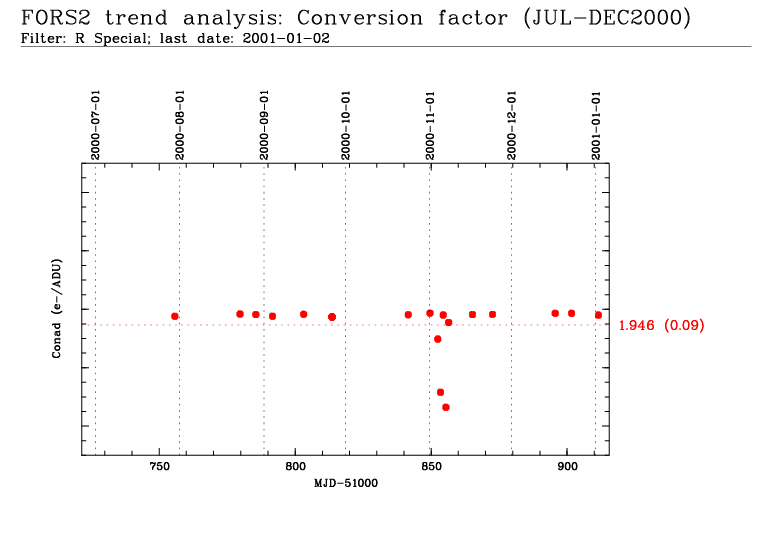
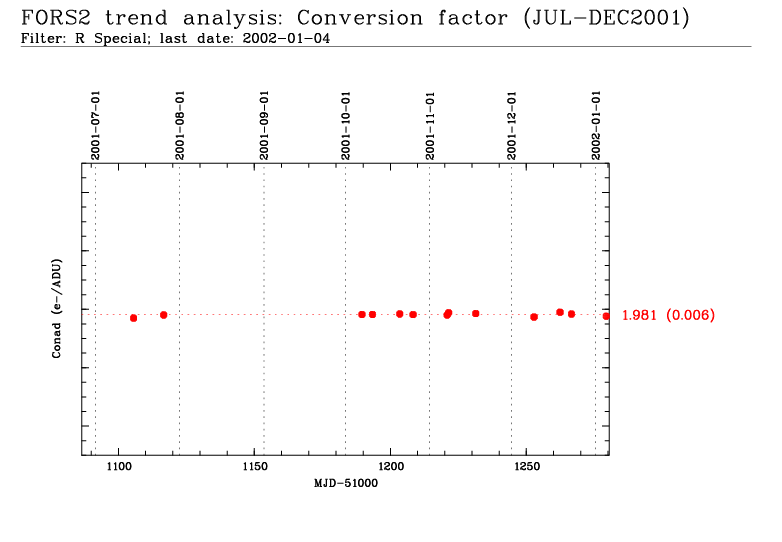
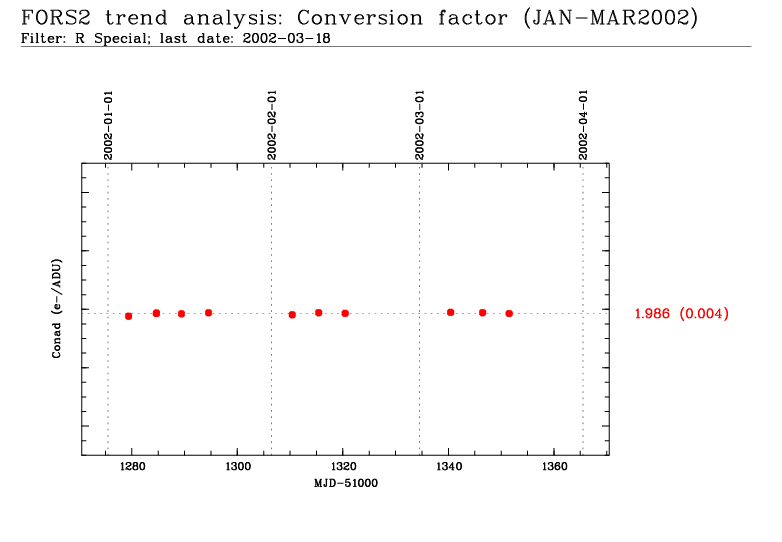
The CONAD/GAIN conversion factor is trended here. The values are estimated from the FORS2 screen flats. For historical reasons (different control software) the CONAD and GAIN parameters are often confused. What is called CONAD here is really the GAIN parameter (units e-/adu). Scoring&thresholds Conversion Factor
The CONAD/GAIN conversion factor is scored tightly with static thresholds following the median average of the current period. The requirement is stability over time.
2010-11-04 - 2010-12-01: The flat field lamp saturates the screen flats. Therefore there are no valid data for that time range. The old pipeline in use until 2008-03-31 derived the CONAD somewhat differently: the whole readout port was divided into a chessboard of 16x16 boxes. For each one of these boxes, the median signal level from the first raw frame was divided by the variance in the difference frame scaled by 2. The median value of the 16x16 values obtained was the accepted value for the conversion factor. For the old FORS2 CCD (until March 2002) the conversion factor was derived from a raw file as 100x100 pixels sigma, corrected for fixed-pattern contribution. The sigma was compared to the square-root of the signal averaged across 4 ports. The conversion factor was trended only for the R_SPECIAL filter.
If the exposure time of the first two raw screen flat fields in the input set of frames is the same (within 4%), the difference frame is computed. Then, the whole readout port is divided into a chessboard of 16x16 boxes. For each one of these boxes, the median signal level from the first raw frame is divided by the variance in the difference frame scaled by 2. The median of the 16x16 values obtained is the conversion factor in e-/ADU. For historical reasons (different control software) the CONAD and GAIN parameters are often confused. What is called CONAD here is really the GAIN parameter (units e-/adu). The CONAD (units ADU/e-) can be calculated as the reciprocal mean of this value.
Fixed-Pattern Noise
The fixed-pattern noise is trended here. It is dominated by the brick wall like pattern in the MIT-CCDs, due to the CCDs thinning procedure. It is particularly strong in U. The fixed-pattern noise is trended only for the B_BESSELL filter. Scoring&thresholds Fixed-Pattern Noise
It is scored loosely with fixed thresholds following the median average of the current period. The requirement is stability over time.
2010-11-04 - 2010-12-01: The flat field lamp saturates the screen flats. Therefore there are no valid data for that time range.
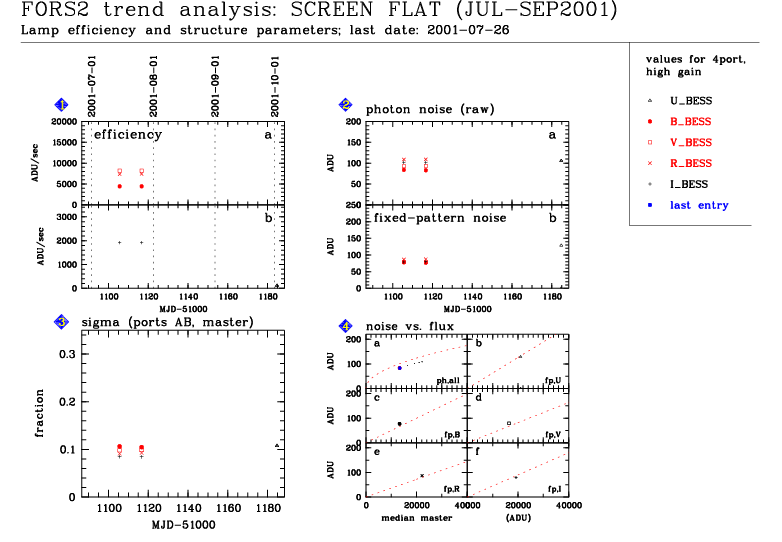
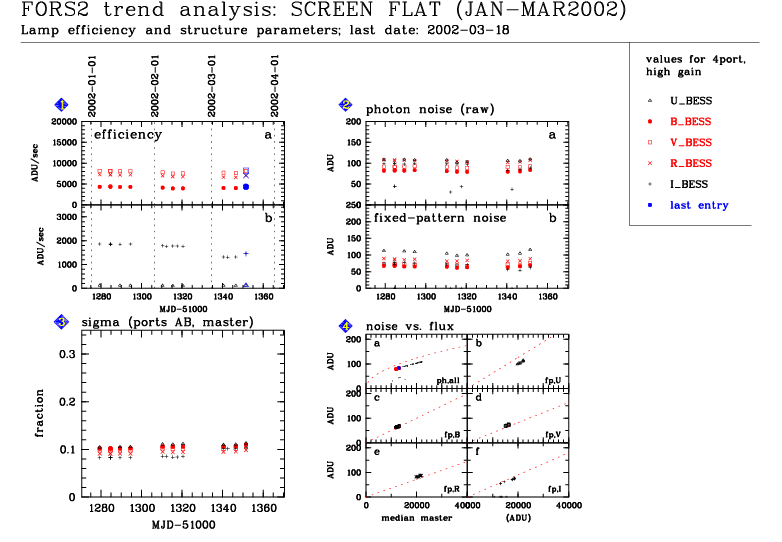
For the old FORS2 CCD (until March 2002) following figures and table provide information gained from imaging screen flats:
The fixed-pattern noise is computed in the following way: The difference of two 100x100 sub-frames of the same master flat field image is determined. These two sub-frames are are shifted with respect to each other by 10 pixels in X- and Y-direction. The population standard deviation of the difference frame, divided by the square root of 2, minus the photon noise (geometrically subtracted) yields the fixed-pattern noise, which is then divided by the median of the respective region.
|
||||||||||||||||||||||||||||||||||||||||||||||||||||||||||||||||||||||||||||||||||||||||||||||||||||||||||||||||||||||||||||||||||||||||||||||||||||||||||||||||||||||||||||||||||||||||||||||||||||||||||||||||||||||||||||||||||||||||||||||||||||||||||||||||||||||||||||||||||||||||||||||||||||||||||||||||||||||||||||||||||||||||||||||||||||||||||||||||||||||||||||||||||||||||||||||||||||||||||||||||||||||||||||||||||||||||||||
| |
|||||||||||||||||||||||||||||||||||||||||||||||||||||||||||||||||||||||||||||||||||||||||||||||||||||||||||||||||||||||||||||||||||||||||||||||||||||||||||||||||||||||||||||||||||||||||||||||||||||||||||||||||||||||||||||||||||||||||||||||||||||||||||||||||||||||||||||||||||||||||||||||||||||||||||||||||||||||||||||||||||||||||||||||||||||||||||||||||||||||||||||||||||||||||||||||||||||||||||||||||||||||||||||||||||||||||||||
 |
|
||||||||||||||||||||||||||||||||||||||||||||||||||||||||||||||||||||||||||||||||||||||||||||||||||||||||||||||||||||||||||||||||||||||||||||||||||||||||||||||||||||||||||||||||||||||||||||||||||||||||||||||||||||||||||||||||||||||||||||||||||||||||||||||||||||||||||||||||||||||||||||||||||||||||||||||||||||||||||||||||||||||||||||||||||||||||||||||||||||||||||||||||||||||||||||||||||||||||||||||||||||||||||||||||||||||||||||