Plot
? |
Symb
? |
Source
* |
Average ? |
Thresholds ? |
N_
data |
QC1
parameter |
Data
downloads |
Remarks |
| method |
value |
unit |
method |
value |
| 1 |
• | QC1DB |
MEDIAN |
0.73 |
e-/ADU |
VAL | 0.70,0.76 |
24 |
conad |
this |
last_yr |
all
|
Chip 1, high gain |
| 2 |
• | QC1DB |
MEDIAN |
0.721 |
e-/ADU |
VAL | 0.70,0.76 |
24 |
conad |
this |
last_yr |
all
|
Chip 2, high gain |
| 3 |
• | QC1DB |
MEDIAN |
1.23 |
e-/ADU |
VAL | 1.18,1.29 |
24 |
conad |
this |
last_yr |
all
|
Chip 1, low gain |
| 4 |
• | QC1DB |
MEDIAN |
1.22 |
e-/ADU |
VAL | 1.18,1.29 |
24 |
conad |
this |
last_yr |
all
|
Chip 2, low gain |
| |
|
*Data sources: QC1DB: QC1 database; LOCAL: local data source
|
Plot 1
scores:  2| 2|
| | data source: | fors2_scrflat
(QC1 database) |
| dataset: | conad | • |
| median: | 0.73 | e-/ADU |
| fixed thresholds: | 0.7...0.76 | e-/ADU |
| N_data plotted: | 24 |
| [click plot for closeup] |
Plot 2
scores: 2|
| | data source: | fors2_scrflat
(QC1 database) |
| dataset: | conad | • |
| median: | 0.721 | e-/ADU |
| fixed thresholds: | 0.7...0.76 | e-/ADU |
| N_data plotted: | 24 |
| [click plot for closeup] |
Plot 3
scores: 2|
| | data source: | fors2_scrflat
(QC1 database) |
| dataset: | conad | • |
| median: | 1.23 | e-/ADU |
| fixed thresholds: | 1.18...1.29 | e-/ADU |
| N_data plotted: | 24 |
| [click plot for closeup] |
Plot 4
scores: 2|
| | data source: | fors2_scrflat
(QC1 database) |
| dataset: | conad | • |
| median: | 1.22 | e-/ADU |
| fixed thresholds: | 1.18...1.29 | e-/ADU |
| N_data plotted: | 24 |
| [click plot for closeup] |
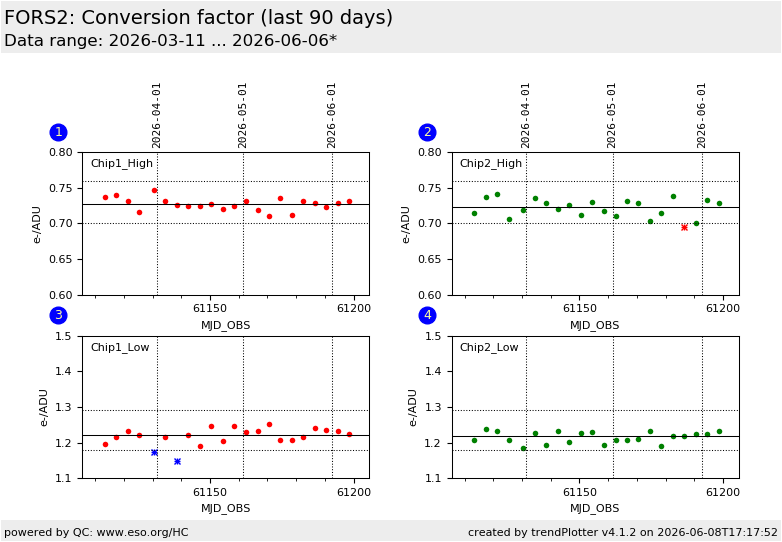
This is the CONAD/GAIN conversion factor health check plot.
The values are estimated from the FORS2 screen flats.
For historical reasons (different control software) the CONAD
and GAIN parameters are often confused. What is called CONAD here
is really the GAIN parameter (units e-/adu).
If the exposure time of the first two raw screen flat fields in the
input set of frames is the same (within 4%), the difference frame is
computed. Then, the whole readout port is divided into a chessboard of
16x16 boxes. For each one of these boxes, the median signal level from
the first raw frame is divided by the variance in the difference frame
scaled by 2. The median value of the 16x16 values obtained is the
accepted value for the conversion factor.
CONAD QC parameters are trended per readout mode for filter B only
(historically B_BESS, now b_HIGH). More information can be found on
the plot tutorial page
TPL.ID=img_cal_scrflat
DB Name: fors2_scrflat
General information
Click on any of the plots to see a close-up version.
The latest date is indicated on top of the plot.
If configured,
- data points belonging to the latest date are specially marked
- statistical averages are indicated by a solid line, and thresholds by broken lines
- outliers are marked by a red asterisk. They are defined as data points outside the
threshold lines
- "aliens" (= data points outside the plot Y limits) are marked by a red arrow (↑ or ↓)
- you can download the data for each parameter set if the 'Data downloads' link shows up
|
