Plot
? |
Symb
? |
Source
* |
Average ? |
Thresholds ? |
N_
data |
QC1
parameter |
Data
downloads |
Remarks |
| method |
value |
unit |
method |
value |
| 1 |
o | QC1DB |
MEDIAN |
0.742 |
e-/ADU |
VAL | 0.68,0.83 |
3 |
gain |
this |
last_yr |
all
|
gain for chip 1, high gain, all filters |
| 2 |
o | QC1DB |
MEDIAN |
0.74 |
e-/ADU |
VAL | 0.68,0.83 |
3 |
gain |
this |
last_yr |
all
|
gain for chip 2, high gain, all filters |
| 3 |
o | QC1DB |
MEDIAN |
1.26 |
e-/ADU |
VAL | 1.21,1.36 |
3 |
gain |
this |
last_yr |
all
|
gain for chip 1, low gain, all filters |
| 4 |
o | QC1DB |
MEDIAN |
1.25 |
e-/ADU |
VAL | 1.21,1.36 |
3 |
gain |
this |
last_yr |
all
|
gain for chip 2, low gain, all filters |
| |
|
*Data sources: QC1DB: QC1 database; LOCAL: local data source
|
Plot 1
scores:  1| 1|
| | data source: | fors2_detmon
(QC1 database) |
| dataset: | gain | o |
| median: | 0.742 | e-/ADU |
| fixed thresholds: | 0.68...0.83 | e-/ADU |
| N_data plotted: | 3 |
| [click plot for closeup] |
Plot 2
scores: 1|
| | data source: | fors2_detmon
(QC1 database) |
| dataset: | gain | o |
| median: | 0.74 | e-/ADU |
| fixed thresholds: | 0.68...0.83 | e-/ADU |
| N_data plotted: | 3 |
| [click plot for closeup] |
Plot 3
scores: 1|
| | data source: | fors2_detmon
(QC1 database) |
| dataset: | gain | o |
| median: | 1.26 | e-/ADU |
| fixed thresholds: | 1.21...1.36 | e-/ADU |
| N_data plotted: | 3 |
| [click plot for closeup] |
Plot 4
scores: 1|
| | data source: | fors2_detmon
(QC1 database) |
| dataset: | gain | o |
| median: | 1.25 | e-/ADU |
| fixed thresholds: | 1.21...1.36 | e-/ADU |
| N_data plotted: | 3 |
| [click plot for closeup] |
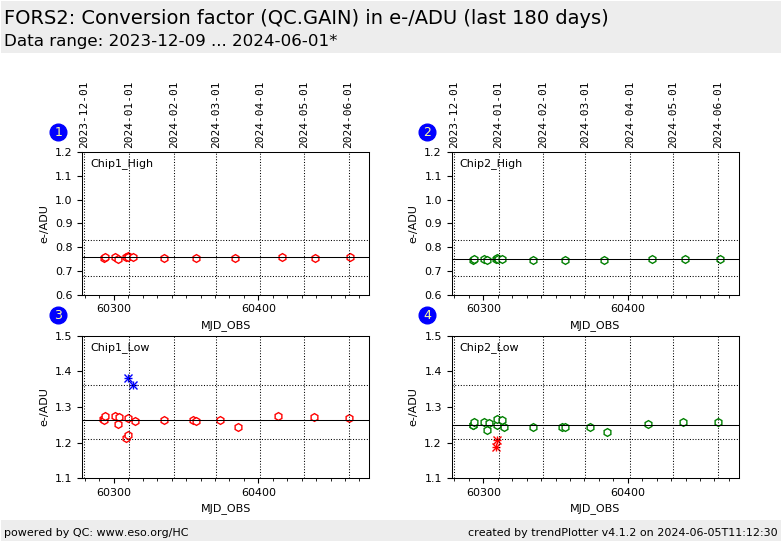
This is the DETMON GAIN health check plot. The gain values (units e-/ADU) are calculated by the detmon_opt_lg recipe (using the Photon Transfer Curve - PTC, method). The data come from a dedicated detmon calibrations consisting of sets of paired flat fields and bias frames with
identical exposure time.
More information can be found on the plot tutorial page
TPL.ID: FORS2_img_tec_detLin
DB Name: fors2_detmon
General information
Click on any of the plots to see a close-up version.
The latest date is indicated on top of the plot.
If configured,
- data points belonging to the latest date are specially marked
- statistical averages are indicated by a solid line, and thresholds by broken lines
- outliers are marked by a red asterisk. They are defined as data points outside the
threshold lines
- "aliens" (= data points outside the plot Y limits) are marked by a red arrow (↑ or ↓)
- you can download the data for each parameter set if the 'Data downloads' link shows up
|
