Plot
? |
Symb
? |
Source
* |
OPS?
** |
Average ? |
Thresholds ? |
N_
data |
QC1
parameter |
Data
downloads |
Remarks |
| method |
value |
unit |
method |
value |
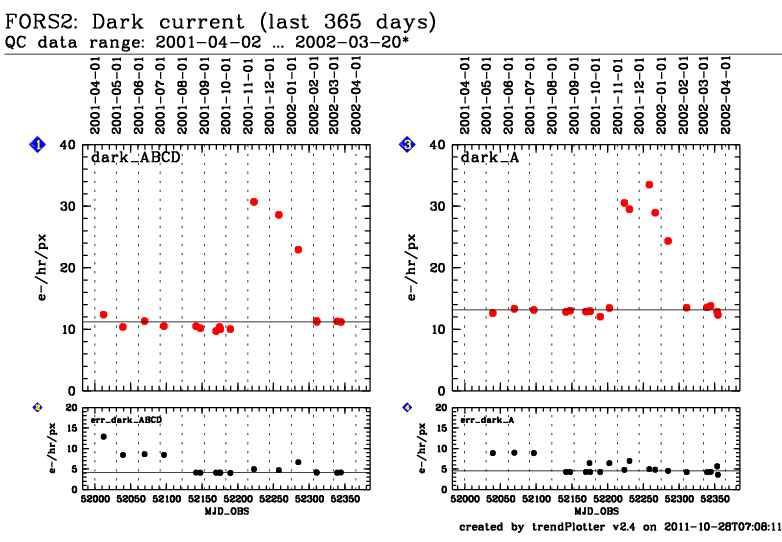
| 1 |
• | QC1DB |
no |
MEDIAN |
11.2 |
e-/hr/px |
none | |
17 |
dark_avg |
this |
last_yr |
all
|
ABCD,1x1,high (Garching) |
| 2 |
• | QC1DB |
no |
MEDIAN |
4.16 |
e-/hr/px |
none | |
17 |
sigma_dark_avg |
this |
last_yr |
all
|
ABCD,1x1,high (Garching) |
| 3 |
• | QC1DB |
no |
MEDIAN |
13.15 |
e-/hr/px |
none | |
20 |
dark_avg |
this |
last_yr |
all
|
A,1x1,high (Garching) |
| 4 |
• | QC1DB |
no |
MEDIAN |
4.56 |
e-/hr/px |
none | |
20 |
sigma_dark_avg |
this |
last_yr |
all
|
A,1x1,high (Garching) |
| |
|
*Data sources: QC1DB: QC1 database; LOCAL: local text file | **OPS: to indicate that OPSLOG data are included
|
General information
Click on any of the plots to see a close-up version.
The latest date is indicated on top of the plot, data points belonging to that date are specially marked.
If configured,
- statistical averages are indicated by a solid line, and thresholds by broken lines
- outliers are marked by a red asterisk. They are defined as data points outside the
threshold lines
- "aliens" (= data points outside the plot Y limits) are marked by a red arrow (↑ or ↓)
- you can download the data for each parameter set if the 'Data downloads' link shows up
|
