Plot
? |
Symb
? |
Source
* |
Average ? |
Thresholds ? |
N_
data |
QC1
parameter |
Data
downloads |
Remarks |
| method |
value |
unit |
method |
value |
| 1 |
• | QC1DB |
none |
|
mag |
none | |
2 |
ext_coeff |
this |
last_yr |
all
|
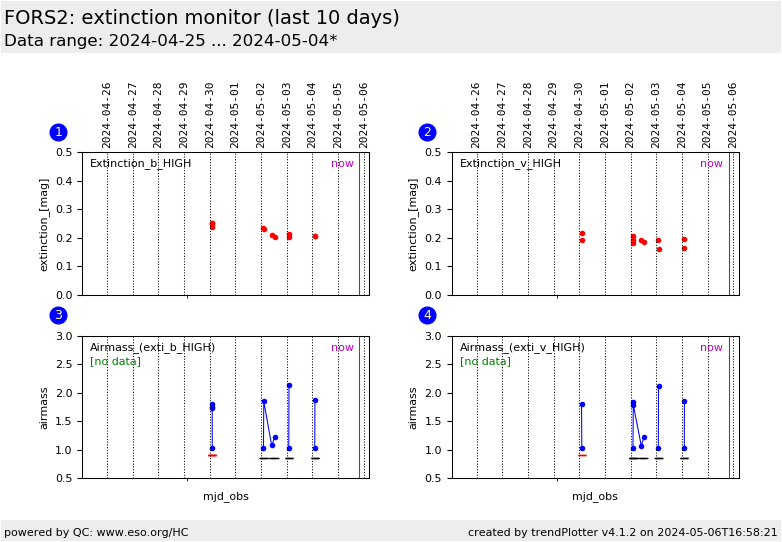
Frame extinction values from FORS2 STD_IMA data for b_HIGH. Values for num_stars <3 suppressed. |
| 2 |
• | QC1DB |
none |
|
mag |
none | |
2 |
ext_coeff |
this |
last_yr |
all
|
same, for filter v_HIGH |
|
| 3 |
• | QC1DB |
none |
|
NONE |
none | |
2 |
airmass |
this |
last_yr |
all
|
Airmass for values in plot 1. For nights classified 'S' or 'Sb' there should always be a pair with delta_AIRM > 0.4. Data points per night are connected by a line. |
| 3 |
– | QC1DB |
none |
|
NONE |
none | |
0 |
mjd_obs |
|
green bar: night has been classified 'S' (photometrically stable) or 'Sb' (photometric at begin but no more data later); red bar: 'N' (not stable); black bar: 'U' (unknown, no low-high-airmass pair taken); all data apply to the filter above |
| 4 |
• | QC1DB |
none |
|
NONE |
none | |
2 |
airmass |
this |
last_yr |
all
|
same, for filter v_HIGH |
| |
|
*Data sources: QC1DB: QC1 database; LOCAL: local data source
|
| Plot 1 | | data source: | fors2_zp_frame
(QC1 database) |
| dataset: | ext_coeff | • |
| average: | none |
| thresholds: | none |
| N_data plotted: | 2 |
| [click plot for closeup] |
| Plot 2 | | data source: | fors2_zp_frame
(QC1 database) |
| dataset: | ext_coeff | • |
| average: | none |
| thresholds: | none |
| N_data plotted: | 2 |
| [click plot for closeup] |
| Plot 3 | | data source: | fors2_zp_frame
(QC1 database) |
dataset:
(numbers below apply to this dataset) | airmass | • |
| average: | none |
| thresholds: | none |
| N_data plotted: | 2 |
| [click plot for closeup] |
| Plot 4 | | data source: | fors2_zp_frame
(QC1 database) |
dataset:
(numbers below apply to this dataset) | airmass | • |
| average: | none |
| thresholds: | none |
| N_data plotted: | 2 |
| [click plot for closeup] |
This plot displays a closeup view of the current last 10 days of extinction measurements
with FORS2 standard star fields. It contains the pipeline results for the
extinction, with the instrumental zeropoint being fixed (read from a static table).
Check out the
extinction report for
the full record of existing data. The bottom panel displays the airmass of the contributing standard star fields,
with the stability flag for the given night color-coded. Only data for chip 1 are displayed. This plot helps to monitor
the execution of the calibration plan for photometric nights.
One can clearly see the inital low-high-airmass pair if acquired. We also
mark 'S'/'Sb' nights by a green bar, 'N' nights in red, and 'U' nights in
black.
More information can be found on
the plot
tutorial page.
General information
Click on any of the plots to see a close-up version.
The latest date is indicated on top of the plot.
If configured,
- data points belonging to the latest date are specially marked
- statistical averages are indicated by a solid line, and thresholds by broken lines
- outliers are marked by a red asterisk. They are defined as data points outside the
threshold lines
- "aliens" (= data points outside the plot Y limits) are marked by a red arrow (↑ or ↓)
- you can download the data for each parameter set if the 'Data downloads' link shows up
|
