Plot
? |
Symb
? |
Source
* |
Average ? |
Thresholds ? |
N_
data |
QC1
parameter |
Data
downloads |
Remarks |
| method |
value |
unit |
method |
value |
| 1 |
. | QC1DB |
none |
|
degree |
VAL | -5,5 |
10 |
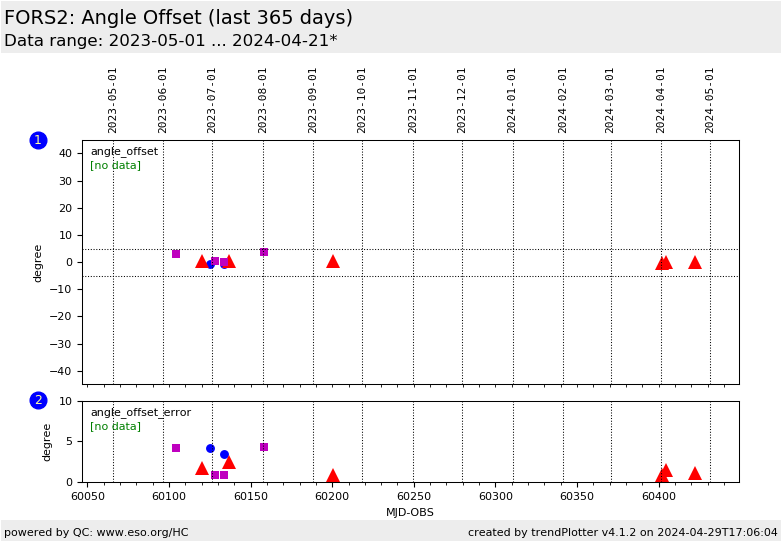
angle_offset |
this |
last_yr |
all
|
difference between measured angle and catalog angle for all bands |
| 1 |
• | QC1DB |
none |
|
degree |
none | |
1 |
angle_offset |
this |
last_yr |
all
|
difference between measured angle and catalog angle for the B band |
| 1 |
♦ | QC1DB |
none |
|
degree |
none | |
0 |
angle_offset |
this |
last_yr |
all
|
difference between measured angle and catalog angle for the V band |
| 1 |
▲ | QC1DB |
none |
|
degree |
none | |
8 |
angle_offset |
this |
last_yr |
all
|
difference between measured angle and catalog angle for the R band |
| 1 |
■ | QC1DB |
none |
|
degree |
none | |
1 |
angle_offset |
this |
last_yr |
all
|
difference between measured angle and catalog angle for the I band |
| 2 |
. | QC1DB |
none |
|
degree |
none | |
10 |
err_angle_offset |
this |
last_yr |
all
|
error of the difference between measured angle and catalog angle for all bands |
| 2 |
• | QC1DB |
none |
|
degree |
none | |
1 |
err_angle_offset |
this |
last_yr |
all
|
error of the difference between measured angle and catalog angle for the B band |
| 2 |
♦ | QC1DB |
none |
|
degree |
none | |
0 |
err_angle_offset |
this |
last_yr |
all
|
error of the difference between measured angle and catalog angle for the V band |
| 2 |
▲ | QC1DB |
none |
|
degree |
none | |
8 |
err_angle_offset |
this |
last_yr |
all
|
error of the difference between measured angle and catalog angle for the R band |
| 2 |
■ | QC1DB |
none |
|
degree |
none | |
1 |
err_angle_offset |
this |
last_yr |
all
|
error of the difference between measured angle and catalog angle for the I band |
| |
|
*Data sources: QC1DB: QC1 database; LOCAL: local data source
|
