FORS2: Bias
| |
| HC PLOTS |
| median level (master) |
 |
| read-out noise (raw) |
|
| read-out noise (master) |
|
| fixed pattern (raw) |
|
| structure (raw) |
|
| pattern (master) |
|
| median level (master, before 2002-04) |
|
| read-out noise (raw, before 2002-04) |
|
| read-out noise (master, before 2002-04) |
|
|
QC1 database (advanced users):
browse |
plot
|
In April 2002 FORS received two new CCDs, which are still in operation. Parameters are measured and trended for each CCD and the 2 standard CCD modes:
- high gain, 100Kp/s, binning 2x2
- low gain, 200Kp/s, binning 2x2
There are also some measurements for unbinned data (binning 1x1) in the QC1 Database.
For the old CCD the trended read-out modes were
- high gain, 4port (ABCD) and 1port (A) read-out, binning 1x1
- low gain, 4port (ABCD) and 1port (A) read-out, binning 1x1
 BIAS median level
QC1_parameters
| FITS key |
QC1 database: table, name |
definition |
class* |
HC_plot** |
more docu |
| QC.MBIAS.LEVEL | fors2_bias..median_master | median value of master bias | CAL |  | [docuSys coming] |
| QC.BIAS.LEVEL | fors2_bias..median_raw | median value of first raw bias | CAL | | [docuSys coming] |
| INS.FOCUS.TEMP | fors2_bias..ins_focus_temp | focus temperature (C degrees) | CAL | | [docuSys coming] |
*Class: KPI - instrument performance; HC - instrument health; CAL - calibration quality; ENG - engineering parameter
**There might be more than one. |
Trending
The median level of master bias is trended
here. For data before 2002-04 look here.
Scoring&thresholds BIAS median level
The median_master is scored with dynamic thresholds following the median
average of the current period. The only requirement on the bias level is
stability on the calibration timescale.
History
| Date |
event |
| Since mid-August 2014 | the bias median level of C1 has been increasing. Finally, it crossed the threshold on 2014-10-05. The issue was investigated and fixed on 2014-10-09 - PPRS-058387. |
| 2015-04-22 | value of BIAS master median changed after adopting new pipeline v.5.0.9. The bias level is calculated after the offset (prescan) subtraction. |
| 2016-01-21 | value of BIAS master median changed again as the new pipeline v.5.2.2 was adopted in the QC system. The previous issue of over estimating level of bias overscan is fixed. Now, the pipeline correctly calculates the overscan level and subtracts it from the bias. The resulting level is positive and close to zero. The previous effect was particularly visible in case of low-gain bias frames. |
Algorithm BIAS median level
The median bias level is calculated considering all pixels in the master or raw bias frames.
Until 2008-03-31 the old pipeline was used, with which the medain levels were derived as follows:
- median level of master bias (QC1 database table fors2_bias, column median_master):
This is the median level of the master bias measured in a 1600x400 pixel window. The window is chosen to cover in both CCDs the regions that can be exposed. The short y dimension is due to the large vignetting of Chip 2.
- median level of first raw bias (QC1 database table fors2_bias, column median_raw):
This is the median level of the first raw bias measured in a 1600x400 pixel window. The window is chosen to cover in both CCDs the regions that can be exposed. The short y dimension is due to the large vignetting of Chip 2.
For the old CCD (until 2002-03) the median was calculated for the whole CCD.
The temperature in the instrument's focus is read from the header of the master bias INS.FOCU.TEMP. It is trended here to check any possible correlation of the bias level with temperature. Such correlation was e.g. found for another optical instrument - VIMOS.
Read-Out noise
The read-out noise is measured in the master (noise_master) and in the raw (RON_r) frames. The difference between values in raw files and master files controls the efficiency of the master creation process.
QC1_parameters
| FITS key |
QC1 database: table, name |
definition |
class* |
HC_plot** |
more docu |
| QC.RON | fors2_bias..RON_r | RON measured on first raw BIAS | CAL | | [docuSys coming] |
| QC.MBIAS.NOISE | fors2_bias..noise_master | noise value of master bias | CAL | | [docuSys coming] |
*Class: KPI - instrument performance; HC - instrument health; CAL - calibration quality; ENG - engineering parameter
**There might be more than one. |
Trending
Both, read-out noise calculated for the master bias and for the raw frames are trended.
Scoring&thresholds Read-Out noise
The read-out noise is tightly scored, with dynamic thresholds following the median average of the current period.
For trending of the read-out master before 2002-04 look here and for the read-out raw before 2002-04, here.
Algorithm Read-Out noise
To calculate the read-ot noise of the raw bias, the difference between
the first and the second raw bias is computed. Then, the standard deviation of
the pixel values in the difference image, divided by √2, is taken.
For the read-out noise master, expected master bias noise is calculated from the ron of the raw data, divided by the square root of the number of frames that were used to create the master bias. Then, the population standard deviation of the pixel values of the
master bias is determined, excluding all pixels that differ more than three times the expected ron from the median level of the master bias.
Thus, master read-out noise depends on the number of frames and the averaging method. The pipeline used until 2008-03-31 used a simple average, whereas the new pipeline does a min-max rejection of the highest and lowest pixel. Therefore it uses 3 instead of 5 frames for the averaging
and therefore the noise of the master bias is higher than with the old pipeline.
For the old CCD (until 2002-03) the rms scatter of the whole CCD was used as read-out noise for both raw (sigma_raw) and master (sigma_master) bias.
History
| Date |
event |
| 2014-11-27 | from now on 20 rather than 5 bias input raw frames are taken in the template; the ron value decreased by sqrt(20/5)=2. |
| 2021-06-09 | DET.OUT1.GAIN/CONAD for 100Kbps/2p/high_gain 1x1 adjusted in headers; RON_r decreased for this setup (PPRS-080731) |
Fixed Pattern
QC1_parameters
| FITS key |
QC1 database: table, name |
definition |
class* |
HC_plot** |
more docu |
| QC.BIAS.FPN | fors2_bias..fpn_r | | CAL | | [docuSys coming] |
*Class: KPI - instrument performance; HC - instrument health; CAL - calibration quality; ENG - engineering parameter
**There might be more than one. |
Trending
The fixed pattern is trended
here.
Scoring&thresholds Fixed Pattern
The fixed patter is scored with dynamic thresholds following the median average of the current period. The only requirement is stability on the calibration timescale.
History
| Date |
event |
| 2016-01-21 | new pipeline v.5.2.2 was adopted in the QC system. |
Algorithm Fixed Pattern
The difference between the first raw bias and the second raw bias (in ADU) shifted by 10x10 pixels, is computed. This is the combination of fixed pattern and read-out noise (scaled by √2). The population standard deviation of this difference is computed and divided by √2. The read-out noise is then quadratically subtracted from the total noise and the result is taken as fixed pattern.
Structure
QC1_parameters
| FITS key |
QC1 database: table, name |
definition |
class* |
HC_plot** |
more docu |
| QC.BIAS.STRUCT | fors2_bias..struct_r | STRUCTURE measured on first raw BIAS | CAL | | [docuSys coming] |
*Class: KPI - instrument performance; HC - instrument health; CAL - calibration quality; ENG - engineering parameter
**There might be more than one. |
Trending
The structure is trended
here.
Scoring&thresholds Structure
The structure is scored with dynamic thresholds following the median average of the current period. The only requirement is stability on the calibration timescale.
History
| Date |
event |
| 2016-01-21 | new pipeline v.5.2.2 was adopted in the QC system. |
Algorithm Structure
The population standard deviation of the pixel values of the first input raw bias is computed. This is the combination of structure, fixed pattern, and read-out noise. The read-out noise and the fixed pattern contributions are then quadratically subtracted, leaving the large scale variations.
Pattern
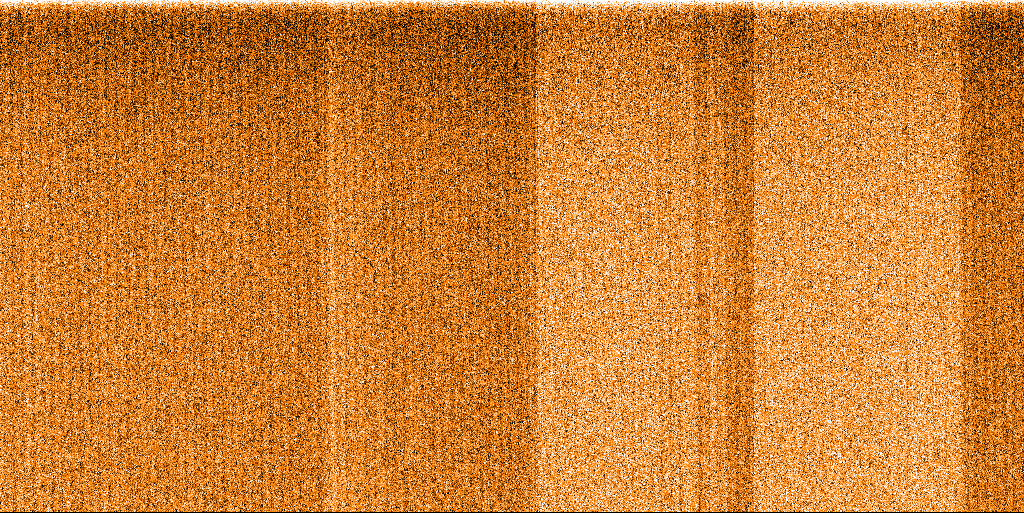 |
Raw BIAS frame, IFU 5, This is an example of a
bias vertical striped pattern.
|
QC1_parameters
| FITS key |
QC1 database: table, name |
definition |
class* |
HC_plot** |
more docu |
| [Pattern calculated by QC procedure] | fors2_bias..pattern | rms of master bias averaged along y-axis | CAL | | [docuSys coming] |
*Class: KPI - instrument performance; HC - instrument health; CAL - calibration quality; ENG - engineering parameter
**There might be more than one. |
Trending
The fixed pattern is trended
here.
Scoring&thresholds Pattern
The pattern is loosely scored with fixed thresholds following the median average of the current period. The only requirement is stability on the calibration timescale.
History
| Date |
event |
| 2016-01-21 | new pipeline v.5.2.2 was adopted in the QC system. |
Algorithm Pattern
The master bias is averaged along its columns. Then the rms of the resulting 1-dimensional frame is used to check for the presence of a bias pattern (predominantly in low gain, 2x2 readout).
|
