Plot
? |
Symb
? |
Source
* |
Average ? |
Thresholds ? |
N_
data |
QC1
parameter |
Data
downloads |
Remarks |
| method |
value |
unit |
method |
value |
| 1 |
• | QC1DB |
none |
|
|
VAL | -0.025,0.005 |
15 |
qc_lin_eff |
this |
last_yr |
all
|
new CCD (after 2008-04): effective non-linearity correction (from DETMON recipe) (normal read mode) |
| 2 |
• | QC1DB |
MEAN |
2.32 |
el/ADU |
VAL | 2.1,2.5 |
74 |
conad |
this |
last_yr |
all
|
new CCD (after 2008-04): GAIN*, from image flats with exptime < 10 sec (normal read mode) |
| 2 |
o | QC1DB |
none |
|
el/ADU |
none | |
0 |
conad |
this |
last_yr |
all
|
old CCD (before 2008-04): GAIN*, from image flats with exptime > 60 sec
(*note: the QC1 parameter is called conad by mistake, it should read gain) |
| |
|
*Data sources: QC1DB: QC1 database; LOCAL: local data source
|
Plot 1
scores:  1| 1|
| | data source: | giraffe_ccd
(QC1 database) |
| dataset: | qc_lin_eff | • |
| average: | none |
| fixed thresholds: | -0.025...0.005 | |
| N_data plotted: | 15 |
| [click plot for closeup] |
Plot 2
scores: 1|
| | data source: | giraffe_ccd
(QC1 database) |
dataset:
(numbers below apply to this dataset) | conad | • |
| mean: | 2.32 | el/ADU |
| fixed thresholds: | 2.1...2.5 | el/ADU |
| N_data plotted: | 74 |
| [click plot for closeup] |
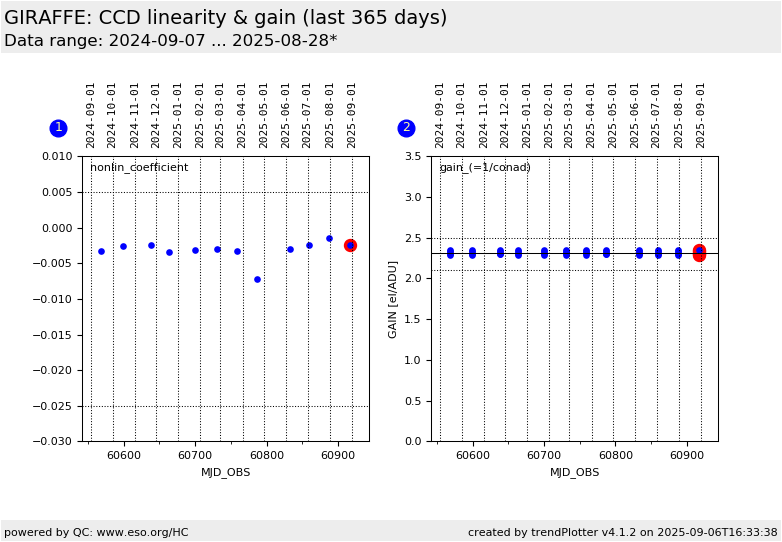
This is the trending plot for the monitoring of the GIRAFFE
CCD linearity and gain. These parameters are derived from image flats.
These data are taken about monthly. Since 2008-07, they are acquired with the
common detector monitoring template and reduced with the corresponding common
recipe.
The CCD was upgraded between 2008-03 and 2008-05. Data from the new CCD are
marked "NEW".
A sequence of image flats is exposed
between 0.5 and 220 secs.
A third-order polynomial is fitted to the mean exposure level as a function of
exposure time. An effective non-linearity correction is derived from this and
plotted in box 1. This is available only since 2008.
The gain (in electrons per ADU) is
also monitored here, as box 2. It is measured from
the difference between two identical raw frames, by comparing the square root
of the signal to its measured rms. Plotted here is the asymptotic value for
exptime → 0 which is the true gain. Find the complete correlation as plot no. 4 under 'correlations'.
The value stored in
the file headers is very close to the one plotted here.
General information
Click on any of the plots to see a close-up version.
The latest date is indicated on top of the plot.
If configured,
- data points belonging to the latest date are specially marked
- statistical averages are indicated by a solid line, and thresholds by broken lines
- outliers are marked by a red asterisk. They are defined as data points outside the
threshold lines
- "aliens" (= data points outside the plot Y limits) are marked by a red arrow (↑ or ↓)
- you can download the data for each parameter set if the 'Data downloads' link shows up
|
