Plot
? |
Symb
? |
Source
* |
Average ? |
Thresholds ? |
N_
data |
QC1
parameter |
Data
downloads |
Remarks |
| method |
value |
unit |
method |
value |
| 1 |
• | QC1DB |
MEDIAN |
0.0163 |
fraction |
VAL | 0.010,0.020 |
15 |
fraction_sig_fp |
this |
last_yr |
all
|
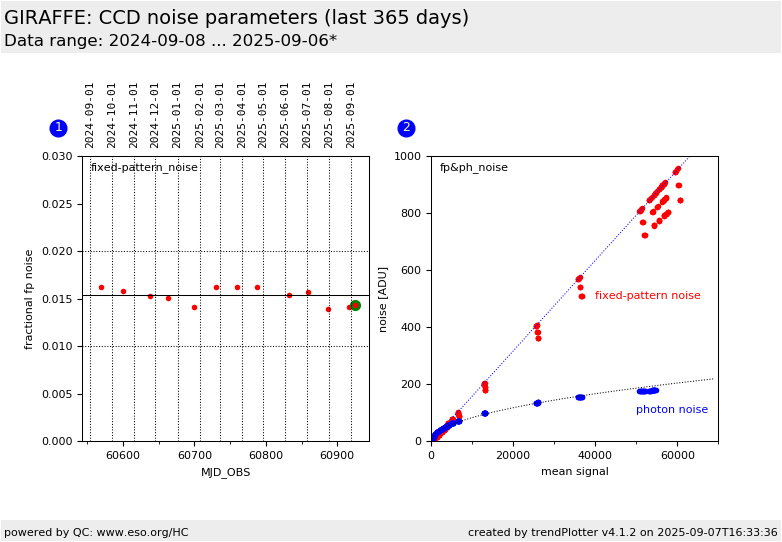
fixed-pattern noise, extracted from QC.FPN parameter (normal read mode).
Note: downloaded data: any exposure time! |
| 2 |
• | QC1DB |
none |
|
ADU |
none | |
345 |
sigma_fp |
this |
last_yr |
all
|
measured fixed-pattern noise, with linear fit |
| 2 |
• | QC1DB |
none |
|
ADU |
none | |
261 |
sigma_ph |
this |
last_yr |
all
|
measured photon noise, with square-root fit, values with mean_signal > 55000 suppressed |
| |
|
*Data sources: QC1DB: QC1 database; LOCAL: local data source
|
Plot 1
scores:  1| 1|
| | data source: | giraffe_ccd
(QC1 database) |
| dataset: | fraction_sig_fp | • |
| median: | 0.0163 | fraction |
| fixed thresholds: | 0.01...0.02 | fraction |
| N_data plotted: | 15 |
| [click plot for closeup] |
Plot 2
scores: not implemented
| | data source: | giraffe_ccd
(QC1 database) |
dataset:
(numbers below apply to this dataset) | sigma_fp | • |
| average: | none |
| thresholds: | none |
| N_data plotted: | 345 |
| [click plot for closeup] |
This is the trending plot for the monitoring of the GIRAFFE
detector noise parameters, derived from image flats.
Data for the old CCD (used until 2008-03) are complete. Due to issues with the
pipeline recipe for
detector monitoring, data for the new CCD have been calculated only since
2009-10.
These frames are taken approximately once per month, as a sequence with
exposure time increasing from 0.5 sec to 220 sec. For each value, a set of 2
image flats is taken, just exposing the CCD without the fibre system.
For each pair, the difference frame is calculated from which the photon noise
is determined. Then a raw frame is taken, shifted by one pixel in X and Y, and
subtracted, in order to randomize the fixed-pattern noise. Finally the
measured total noise and the photon noise are subtracted and give the
fixed-pattern noise. It is trended as fraction of the mean signal in plot no.
1.
The second plot displays the whole sequence of image flats, with the
measured photon noise on a square-root curve, and the fixed-pattern noise on a
linear curve. The intersection of both fits marks the transition from the
photon-noise to the fixed-pattern noise regime.
Find more information about GIRAFFE image flats frames
here.
Other QC parameters related to detector properties (like dark,
linearity, gain) are trended in the same group.
General information
Click on any of the plots to see a close-up version.
The latest date is indicated on top of the plot.
If configured,
- data points belonging to the latest date are specially marked
- statistical averages are indicated by a solid line, and thresholds by broken lines
- outliers are marked by a red asterisk. They are defined as data points outside the
threshold lines
- "aliens" (= data points outside the plot Y limits) are marked by a red arrow (↑ or ↓)
- you can download the data for each parameter set if the 'Data downloads' link shows up
|
