Plot
? |
Symb
? |
Source
* |
Average ? |
Thresholds ? |
N_
data |
QC1
parameter |
Data
downloads |
Remarks |
| method |
value |
unit |
method |
value |
| 1 |
• | QC1DB |
none |
|
rad/Volt |
VAL | -1,1 |
28 |
piezo3_response1_diff |
this |
last_yr |
all
|
Piezo 3, response 1, difference to stored value, FT DIT=0.00084s |
| 1 |
• | QC1DB |
none |
|
rad/Volt |
none | |
28 |
piezo3_response1_diff |
this |
last_yr |
all
|
Piezo 3, response 1, difference to stored value, FT DIT=0.00085s |
| 1 |
• | QC1DB |
none |
|
rad/Volt |
none | |
28 |
piezo3_response1_diff |
this |
last_yr |
all
|
Piezo 3, response 1, difference to stored value, FT DIT=0.00300s |
| 1 |
• | QC1DB |
none |
|
rad/Volt |
none | |
28 |
piezo3_response1_diff |
this |
last_yr |
all
|
Piezo 3, response 1, difference to stored value, FT DIT=0.01000s |
| 2 |
• | QC1DB |
none |
|
rad/Volt |
VAL | -1,1 |
28 |
piezo3_response2_diff |
this |
last_yr |
all
|
Piezo 3, response 2, difference to stored value, FT DIT=0.00084s |
| 2 |
• | QC1DB |
none |
|
rad/Volt |
none | |
28 |
piezo3_response2_diff |
this |
last_yr |
all
|
Piezo 3, response 2, difference to stored value, FT DIT=0.00085s |
| 2 |
• | QC1DB |
none |
|
rad/Volt |
none | |
28 |
piezo3_response2_diff |
this |
last_yr |
all
|
Piezo 3, response 2, difference to stored value, FT DIT=0.00300s |
| 2 |
• | QC1DB |
none |
|
rad/Volt |
none | |
28 |
piezo3_response2_diff |
this |
last_yr |
all
|
Piezo 3, response 2, difference to stored value, FT DIT=0.01000s |
| 3 |
• | QC1DB |
none |
|
rad/Volt |
VAL | -1,1 |
28 |
piezo3_response3_diff |
this |
last_yr |
all
|
Piezo 3, response 3, difference to stored value, FT DIT=0.00084s |
| 3 |
• | QC1DB |
none |
|
rad/Volt |
none | |
28 |
piezo3_response3_diff |
this |
last_yr |
all
|
Piezo 3, response 3, difference to stored value, FT DIT=0.00085s |
| 3 |
• | QC1DB |
none |
|
rad/Volt |
none | |
28 |
piezo3_response3_diff |
this |
last_yr |
all
|
Piezo 3, response 3, difference to stored value, FT DIT=0.00300s |
| 3 |
• | QC1DB |
none |
|
rad/Volt |
none | |
28 |
piezo3_response3_diff |
this |
last_yr |
all
|
Piezo 3, response 3, difference to stored value, FT DIT=0.01000s |
| 4 |
• | QC1DB |
none |
|
rad/Volt |
VAL | -1,1 |
28 |
piezo3_response4_diff |
this |
last_yr |
all
|
Piezo 3, response 4, difference to stored value, FT DIT=0.00084s |
| 4 |
• | QC1DB |
none |
|
rad/Volt |
none | |
28 |
piezo3_response4_diff |
this |
last_yr |
all
|
Piezo 3, response 4, difference to stored value, FT DIT=0.00085s |
| 4 |
• | QC1DB |
none |
|
rad/Volt |
none | |
28 |
piezo3_response4_diff |
this |
last_yr |
all
|
Piezo 3, response 4, difference to stored value, FT DIT=0.00300s |
| 4 |
• | QC1DB |
none |
|
rad/Volt |
none | |
28 |
piezo3_response4_diff |
this |
last_yr |
all
|
Piezo 3, response 4, difference to stored value, FT DIT=0.01000s |
| 5 |
• | QC1DB |
none |
|
rad/Volt |
VAL | -1,1 |
28 |
piezo3_response5_diff |
this |
last_yr |
all
|
Piezo 3, response 5, difference to stored value, FT DIT=0.00084s |
| 5 |
• | QC1DB |
none |
|
rad/Volt |
none | |
28 |
piezo3_response5_diff |
this |
last_yr |
all
|
Piezo 3, response 5, difference to stored value, FT DIT=0.00085s |
| 5 |
• | QC1DB |
none |
|
rad/Volt |
none | |
28 |
piezo3_response5_diff |
this |
last_yr |
all
|
Piezo 3, response 5, difference to stored value, FT DIT=0.00300s |
| 5 |
• | QC1DB |
none |
|
rad/Volt |
none | |
28 |
piezo3_response5_diff |
this |
last_yr |
all
|
Piezo 3, response 5, difference to stored value, FT DIT=0.01000s |
| |
|
*Data sources: QC1DB: QC1 database; LOCAL: local data source
|
Plot 1
scores: not implemented
| | data source: | gravity_piezo
(QC1 database) |
dataset:
(numbers below apply to this dataset) | piezo3_response1_diff | • |
| average: | none |
| fixed thresholds: | -1...1 | rad/Volt |
| N_data plotted: | 28 |
| [click plot for closeup] |
Plot 2
scores: not implemented
| | data source: | gravity_piezo
(QC1 database) |
dataset:
(numbers below apply to this dataset) | piezo3_response2_diff | • |
| average: | none |
| fixed thresholds: | -1...1 | rad/Volt |
| N_data plotted: | 28 |
| [click plot for closeup] |
Plot 3
scores: not implemented
| | data source: | gravity_piezo
(QC1 database) |
dataset:
(numbers below apply to this dataset) | piezo3_response3_diff | • |
| average: | none |
| fixed thresholds: | -1...1 | rad/Volt |
| N_data plotted: | 28 |
| [click plot for closeup] |
Plot 4
scores: not implemented
| | data source: | gravity_piezo
(QC1 database) |
dataset:
(numbers below apply to this dataset) | piezo3_response4_diff | • |
| average: | none |
| fixed thresholds: | -1...1 | rad/Volt |
| N_data plotted: | 28 |
| [click plot for closeup] |
Plot 5
scores: not implemented
| | data source: | gravity_piezo
(QC1 database) |
dataset:
(numbers below apply to this dataset) | piezo3_response5_diff | • |
| average: | none |
| fixed thresholds: | -1...1 | rad/Volt |
| N_data plotted: | 28 |
| [click plot for closeup] |
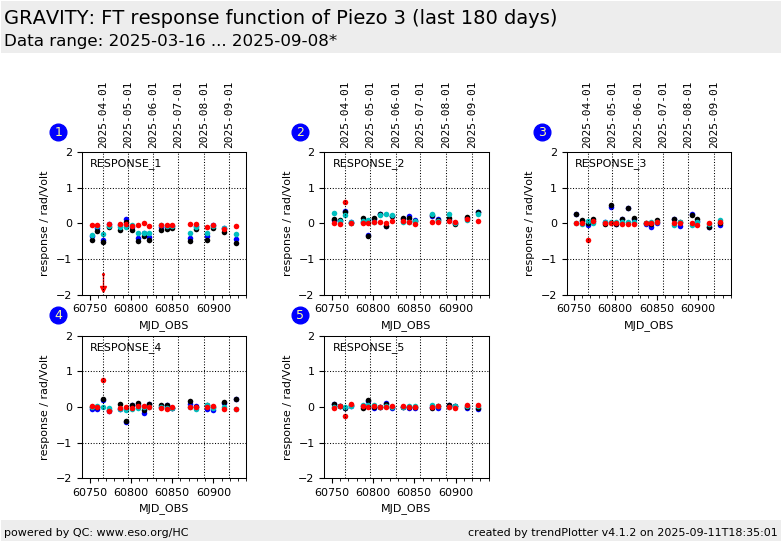
Trending plot for the piezo response.
For each of the four piezos, five different responses are measured. The plots show the difference
between the measured response and the response values as stored in the headers of the raw files.
The measured values can be found in the product header keys QC.FT.KAL.P<n>_RESP<m>, the stored
values in ESO.FT.KAL.P<n>_RESP<m>, with <n>=1, 2, 3, 4 and <m>=1, 2, 3, 4, 5. For each of the 20
combinations of piezo and response, there are four different data sets for the four FT DITs in use:
0.84, 0.85, 3, and 10 ms.
General information
Click on any of the plots to see a close-up version.
The latest date is indicated on top of the plot.
If configured,
- data points belonging to the latest date are specially marked
- statistical averages are indicated by a solid line, and thresholds by broken lines
- outliers are marked by a red asterisk. They are defined as data points outside the
threshold lines
- "aliens" (= data points outside the plot Y limits) are marked by a red arrow (↑ or ↓)
- you can download the data for each parameter set if the 'Data downloads' link shows up
|
