Plot
? |
Symb
? |
Source
* |
Average ? |
Thresholds ? |
N_
data |
QC1
parameter |
Data
downloads |
Remarks |
| method |
value |
unit |
method |
value |
| 1 |
• | QC1DB |
MEDIAN |
7.95e+03 |
mag |
VAL | 1000,25000 |
22 |
qc_zpoint_peak |
this |
last_yr |
all
|
Measured source peak value, chip 4 |
| 2 |
• | QC1DB |
MEDIAN |
9.26e+03 |
mag |
VAL | 1000,25000 |
22 |
qc_zpoint_peak |
this |
last_yr |
all
|
Measured source peak value, chip 3 |
| 3 |
• | QC1DB |
MEDIAN |
8.53e+03 |
mag |
VAL | 1000,25000 |
22 |
qc_zpoint_peak |
this |
last_yr |
all
|
Means of the measured source peak value of the four chips |
| 4 |
• | QC1DB |
MEDIAN |
8.53e+03 |
mag |
VAL | 1000,25000 |
22 |
qc_zpoint_peak |
this |
last_yr |
all
|
Measured source peak value, chip 1 |
| 5 |
• | QC1DB |
MEDIAN |
7.47e+03 |
mag |
VAL | 1000,25000 |
22 |
qc_zpoint_peak |
this |
last_yr |
all
|
Measured source peak value, chip 2 |
| 6 |
• | QC1DB |
MEDIAN |
1.33e+03 |
mag |
VAL | 0,4000 |
22 |
qc_zpoint_peak |
this |
last_yr |
all
|
Standard deviations of the measured source peak value of the four chips |
| |
|
*Data sources: QC1DB: QC1 database; LOCAL: local data source
|
Plot 4
scores: not implemented
| | data source: | hawki_zp
(QC1 database) |
| dataset: | qc_zpoint_peak | • |
| median: | 8.53e+03 | mag |
| fixed thresholds: | 1000...25000 | mag |
| N_data plotted: | 22 |
| [click on plot for closeup] |
Plot 5
scores: not implemented
| | data source: | hawki_zp
(QC1 database) |
| dataset: | qc_zpoint_peak | • |
| median: | 7.47e+03 | mag |
| fixed thresholds: | 1000...25000 | mag |
| N_data plotted: | 22 |
| [click on plot for closeup] |
Plot 2
scores: not implemented
| | data source: | hawki_zp
(QC1 database) |
| dataset: | qc_zpoint_peak | • |
| median: | 9.26e+03 | mag |
| fixed thresholds: | 1000...25000 | mag |
| N_data plotted: | 22 |
| [click on plot for closeup] |
Plot 1
scores: not implemented
| | data source: | hawki_zp
(QC1 database) |
| dataset: | qc_zpoint_peak | • |
| median: | 7.95e+03 | mag |
| fixed thresholds: | 1000...25000 | mag |
| N_data plotted: | 22 |
| [click on plot for closeup] |
Plot 3
scores: not implemented
| | data source: | hawki_zp
(QC1 database) |
| dataset: | qc_zpoint_peak | • |
| median: | 8.53e+03 | mag |
| fixed thresholds: | 1000...25000 | mag |
| N_data plotted: | 22 |
| [click on plot for closeup] |
Plot 6
scores: not implemented
| | data source: | hawki_zp
(QC1 database) |
| dataset: | qc_zpoint_peak | • |
| median: | 1.33e+03 | mag |
| fixed thresholds: | 0...4000 | mag |
| N_data plotted: | 22 |
| [click on plot for closeup] |
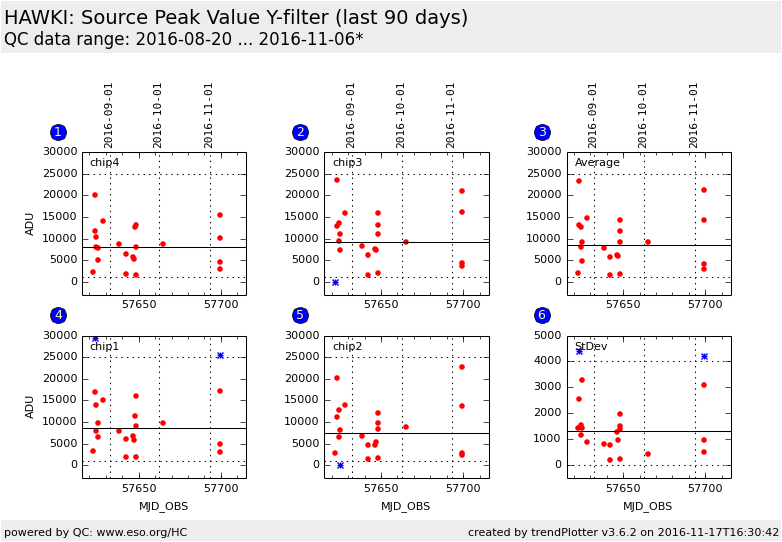
Trending report for source peak value.
QC parameter is derived from photometric standard star calibration frames.
Name:
Fits header: QC.ZPOINT.PEAK,
QC1 DB: qc_zpoint_peak
Description:
The peak value of the photometric standard star PSF.
Values > 25000 ADU indicate saturation which results in rejection of the
QC.ATX0 value.
Setup:
INS.FILT1.NAME=Y
These plots describe:
Fig. 1. chip4: The QC parameter for chip #4.
Fig. 2. chip3: The QC parameter for chip #3.
Fig. 3. Average: The QC parameter averaged over all detectors.
This view is sensitive to common changes.
Fig. 4. chip1: The QC parameter for chip #1.
Fig. 5. chip2: The QC parameter for chip #2.
Fig. 6. Scatter View: The standard deviation of the QC parameter, obtained from the sample of all detectors.
This view is sensitive changes of individual detectors.
Find more information on the HAWKI photometric zeropoint tutorial page.
General information
Click on any of the plots to see a close-up version.
The latest date is indicated on top of the plot.
If configured,
- data points belonging to the latest date are specially marked
- statistical averages are indicated by a solid line, and thresholds by broken lines
- outliers are marked by a red asterisk. They are defined as data points outside the
threshold lines
- "aliens" (= data points outside the plot Y limits) are marked by a red arrow (↑ or ↓)
- you can download the data for each parameter set if the 'Data downloads' link shows up
|
