Plot
? |
Symb
? |
Source
* |
Average ? |
Thresholds ? |
N_
data |
QC1
parameter |
Data
downloads |
Remarks |
| method |
value |
unit |
method |
value |
| 1 |
• | QC1DB |
none |
|
ADU |
none | |
9 |
qc_pixoff |
this |
last_yr |
all
|
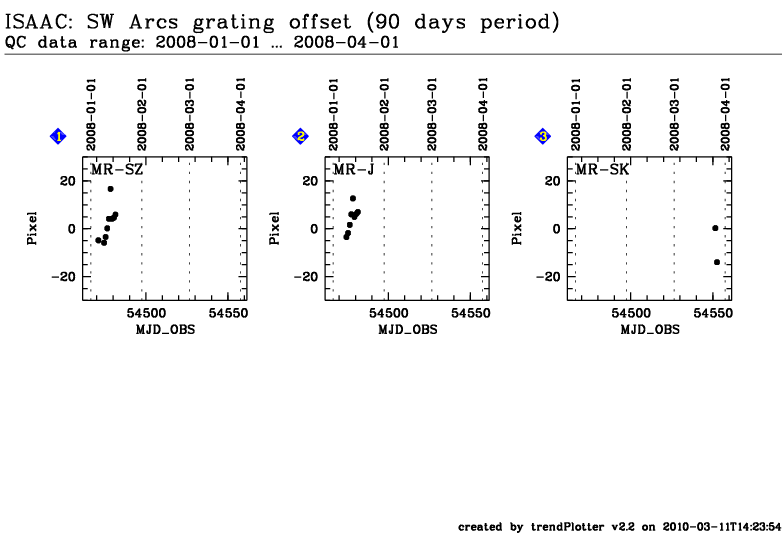
grating offset in pixel for SW, MR, SH, Argon and Xenon lamp |
| 2 |
• | QC1DB |
none |
|
ADU |
none | |
8 |
qc_pixoff |
this |
last_yr |
all
|
grating offset in pixel for SW, MR, J, Argon and Xenon lamp |
| 3 |
• | QC1DB |
none |
|
ADU |
none | |
2 |
qc_pixoff |
this |
last_yr |
all
|
grating offset in pixel for SW, MR, SK, Argon and Xenon lamp |
| |
|
*Data sources: QC1DB: QC1 database; LOCAL: local text file
|
This plot
This is the trending plot for the ISAAC arc lamp calibrations of the SW-arm
The QC parameter is the offset between the nominal central wavelength
(read from the fits header INS.GRAT.WLEN) and the central wavelength derived
from the wavelength solution of the pipeline recipe (HIERARCH ESO QC WLEN) . The offset is given in
pixel units.
These plots describe:
1. Offset for SW-arm, LR-grating, SH-filter. Both Argon and Xenon lamps on.
2. Offset for SW-arm, LR-grating, SK-filter. Both Argon and Xenon lamps on.
3. Offset for SW-arm, LR-grating, J-filter. Both Argon and Xenon lamps on.
4. Offset for SW-arm, MR-grating, SH-filter. Both Argon and Xenon lamps are on.
5. Offset for SW-arm, MR-grating, SK-filter. Both Argon and Xenon lamps are on.
6. Offset for SW-arm, MR-grating, J-filter. Both Argon and Xenon lamps are on.
Find more information about ISAAC QC parameters derived from arc frames
here.
General information
Click on any of the plots to see a close-up version.
The latest date is indicated on top of the plot, data points belonging to that date are specially marked.
If configured,
- statistical averages are indicated by a solid line, and thresholds by broken lines
- outliers are marked by a red asterisk. They are defined as data points outside the
threshold lines
- "aliens" (= data points outside the plot Y limits) are marked by a red arrow (↑ or ↓)
- you can download the data for each parameter set if the 'Data downloads' link shows up
|
