Plot
? |
Symb
? |
Source
* |
Average ? |
Thresholds ? |
N_
data |
QC1
parameter |
Data
downloads |
Remarks |
| method |
value |
unit |
method |
value |
| 1 |
• | QC1DB |
none |
|
ADU |
none | |
1 |
mean_UL |
this |
last_yr |
all
|
Product Flat quadrant mean for SW, LR, SZ |
| 1 |
• | QC1DB |
none |
|
ADU |
none | |
4 |
mean_UL |
this |
last_yr |
all
|
Product Flat quadrant mean for SW, LR, J |
| 1 |
• | QC1DB |
none |
|
ADU |
none | |
26 |
mean_UL |
this |
last_yr |
all
|
Product Flat quadrant mean for SW, LR, SH |
| 1 |
• | QC1DB |
none |
|
ADU |
none | |
52 |
mean_UL |
this |
last_yr |
all
|
Product Flat quadrant mean for SW, LR, SK |
| 2 |
• | QC1DB |
none |
|
ADU |
none | |
1 |
mean_UR |
this |
last_yr |
all
|
Product Flat quadrant mean for SW, LR, SZ |
| 2 |
• | QC1DB |
none |
|
ADU |
none | |
4 |
mean_UR |
this |
last_yr |
all
|
Product Flat quadrant mean for SW, LR, J |
| 2 |
• | QC1DB |
none |
|
ADU |
none | |
26 |
mean_UR |
this |
last_yr |
all
|
Product Flat quadrant mean for SW, LR, SH |
| 2 |
• | QC1DB |
none |
|
ADU |
none | |
52 |
mean_UR |
this |
last_yr |
all
|
Product Flat quadrant mean for SW, LR, SK |
| 3 |
• | QC1DB |
none |
|
ADU |
none | |
2 |
mean_UL |
this |
last_yr |
all
|
Product Flat quadrant mean for SW, MR, SZ |
| 3 |
• | QC1DB |
none |
|
ADU |
none | |
0 |
mean_UL |
this |
last_yr |
all
|
Product Flat quadrant mean for SW, MR, J |
| 3 |
• | QC1DB |
none |
|
ADU |
none | |
9 |
mean_UL |
this |
last_yr |
all
|
Product Flat quadrant mean for SW, MR, SH |
| 3 |
• | QC1DB |
none |
|
ADU |
none | |
54 |
mean_UL |
this |
last_yr |
all
|
Product Flat quadrant mean for SW, MR, SK |
| 4 |
• | QC1DB |
none |
|
ADU |
none | |
2 |
mean_UR |
this |
last_yr |
all
|
Product Flat quadrant mean for SW, MR, SZ |
| 4 |
• | QC1DB |
none |
|
ADU |
none | |
0 |
mean_UR |
this |
last_yr |
all
|
Product Flat quadrant mean for SW, MR, J |
| 4 |
• | QC1DB |
none |
|
ADU |
none | |
9 |
mean_UR |
this |
last_yr |
all
|
Product Flat quadrant mean for SW, MR, SH |
| 4 |
• | QC1DB |
none |
|
ADU |
none | |
54 |
mean_UR |
this |
last_yr |
all
|
Product Flat quadrant mean for SW, MR, SK |
| 5 |
• | QC1DB |
none |
|
ADU |
none | |
1 |
mean_LL |
this |
last_yr |
all
|
Product Flat quadrant mean for SW, LR, SZ |
| 5 |
• | QC1DB |
none |
|
ADU |
none | |
4 |
mean_LL |
this |
last_yr |
all
|
Product Flat quadrant mean for SW, LR, J |
| 5 |
• | QC1DB |
none |
|
ADU |
none | |
26 |
mean_LL |
this |
last_yr |
all
|
Product Flat quadrant mean for SW, LR, SH |
| 5 |
• | QC1DB |
none |
|
ADU |
none | |
52 |
mean_LL |
this |
last_yr |
all
|
Product Flat quadrant mean for SW, LR, SK |
| 6 |
• | QC1DB |
none |
|
ADU |
none | |
1 |
mean_LR |
this |
last_yr |
all
|
Product Flat quadrant mean for SW, LR, SZ |
| 6 |
• | QC1DB |
none |
|
ADU |
none | |
4 |
mean_LR |
this |
last_yr |
all
|
Product Flat quadrant mean for SW, LR, J |
| 6 |
• | QC1DB |
none |
|
ADU |
none | |
26 |
mean_LR |
this |
last_yr |
all
|
Product Flat quadrant mean for SW, LR, SH |
| 6 |
• | QC1DB |
none |
|
ADU |
none | |
52 |
mean_LR |
this |
last_yr |
all
|
Product Flat quadrant mean for SW, LR, SK |
| 7 |
• | QC1DB |
none |
|
ADU |
none | |
2 |
mean_LL |
this |
last_yr |
all
|
Product Flat quadrant mean for SW, MR, SZ |
| 7 |
• | QC1DB |
none |
|
ADU |
none | |
0 |
mean_LL |
this |
last_yr |
all
|
Product Flat quadrant mean for SW, MR, J |
| 7 |
• | QC1DB |
none |
|
ADU |
none | |
9 |
mean_LL |
this |
last_yr |
all
|
Product Flat quadrant mean for SW, MR, SH |
| 7 |
• | QC1DB |
none |
|
ADU |
none | |
54 |
mean_LL |
this |
last_yr |
all
|
Product Flat quadrant mean for SW, MR, SK |
| 8 |
• | QC1DB |
none |
|
ADU |
none | |
2 |
mean_LR |
this |
last_yr |
all
|
Product Flat quadrant mean for SW, MR, SZ |
| 8 |
• | QC1DB |
none |
|
ADU |
none | |
0 |
mean_LR |
this |
last_yr |
all
|
Product Flat quadrant mean for SW, MR, J |
| 8 |
• | QC1DB |
none |
|
ADU |
none | |
9 |
mean_LR |
this |
last_yr |
all
|
Product Flat quadrant mean for SW, MR, SH |
| 8 |
• | QC1DB |
none |
|
ADU |
none | |
54 |
mean_LR |
this |
last_yr |
all
|
Product Flat quadrant mean for SW, MR, SK |
| |
|
*Data sources: QC1DB: QC1 database; LOCAL: local text file
|
| Plot 1 | | data source: | isaac_spflat
(QC1 database) |
parameter | dataset:
(numbers applicable to • ) | mean_UL | • |
| average: | none |
| thresholds: | none |
| N_data: | 1 |
| [click on plot for closeup] |

| Plot 2 | | data source: | isaac_spflat
(QC1 database) |
parameter | dataset:
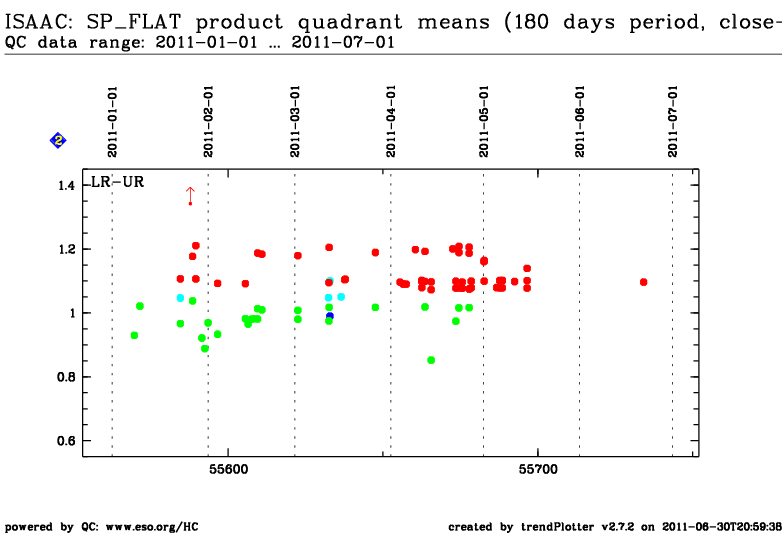
(numbers applicable to • ) | mean_UR | • |
| average: | none |
| thresholds: | none |
| N_data: | 1 |
| [click on plot for closeup] |
| Plot 3 | | data source: | isaac_spflat
(QC1 database) |
parameter | dataset:
(numbers applicable to • ) | mean_UL | • |
| average: | none |
| thresholds: | none |
| N_data: | 2 |
| [click on plot for closeup] |

| Plot 4 | | data source: | isaac_spflat
(QC1 database) |
parameter | dataset:
(numbers applicable to • ) | mean_UR | • |
| average: | none |
| thresholds: | none |
| N_data: | 2 |
| [click on plot for closeup] |

| Plot 5 | | data source: | isaac_spflat
(QC1 database) |
parameter | dataset:
(numbers applicable to • ) | mean_LL | • |
| average: | none |
| thresholds: | none |
| N_data: | 1 |
| [click on plot for closeup] |

| Plot 6 | | data source: | isaac_spflat
(QC1 database) |
parameter | dataset:
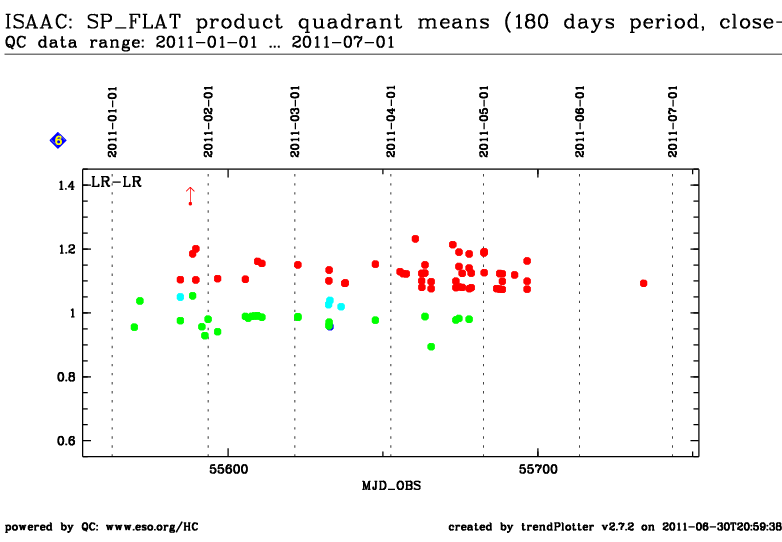
(numbers applicable to • ) | mean_LR | • |
| average: | none |
| thresholds: | none |
| N_data: | 1 |
| [click on plot for closeup] |
| Plot 7 | | data source: | isaac_spflat
(QC1 database) |
parameter | dataset:
(numbers applicable to • ) | mean_LL | • |
| average: | none |
| thresholds: | none |
| N_data: | 2 |
| [click on plot for closeup] |

| Plot 8 | | data source: | isaac_spflat
(QC1 database) |
parameter | dataset:
(numbers applicable to • ) | mean_LR | • |
| average: | none |
| thresholds: | none |
| N_data: | 2 |
| [click on plot for closeup] |
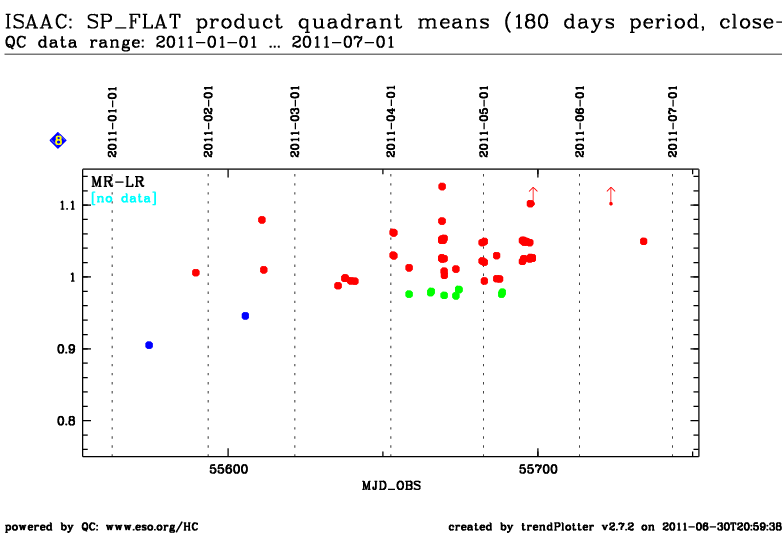
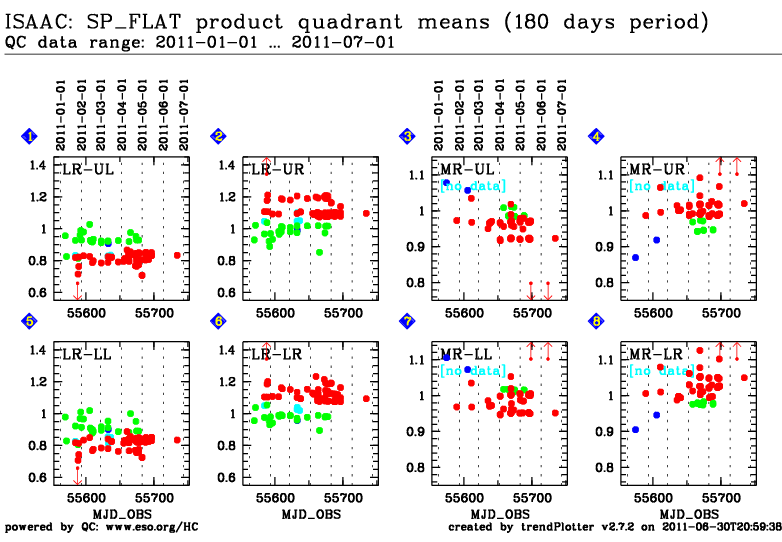
This is the trending plot for the ISAAC spectroscopic flat calibrations of the SW-arm,
LR-grating only
QC parameter are derived from post-pipeline
Quality Control processes in Garching, hence there are no
values from Paranal to be included.
These plots describe:
1. LR grating flats UL quadrant median, all bands.
2. LR grating flats UR quadrant median, all bands.
3. MR grating flats UL quadrant median, all bands.
4. MR grating flats UR quadrant median, all bands.
5. LR grating flats LL quadrant median, all bands.
6. LR grating flats LR quadrant median, all bands.
7. MR grating flats LL quadrant median, all bands.
8. MR grating flats LR quadrant median, all bands.
Find more information about ISAAC QC parameters derived from flat lamp frames
here.
General information
Click on any of the plots to see a close-up version.
The latest date is indicated on top of the plot, data points belonging to that date are specially marked.
If configured,
- statistical averages are indicated by a solid line, and thresholds by broken lines
- outliers are marked by a red asterisk. They are defined as data points outside the
threshold lines
- "aliens" (= data points outside the plot Y limits) are marked by a red arrow (↑ or ↓)
- you can download the data for each parameter set if the 'Data downloads' link shows up
|
