Plot
? |
Symb
? |
Source
* |
Average ? |
Thresholds ? |
N_
data |
QC1
parameter |
Data
downloads |
Remarks |
| method |
value |
unit |
method |
value |
| 1 |
• | QC1DB |
none |
|
ADU |
VAL | 1180.,1220. |
90 |
level1_mean |
this |
last_yr |
all
|
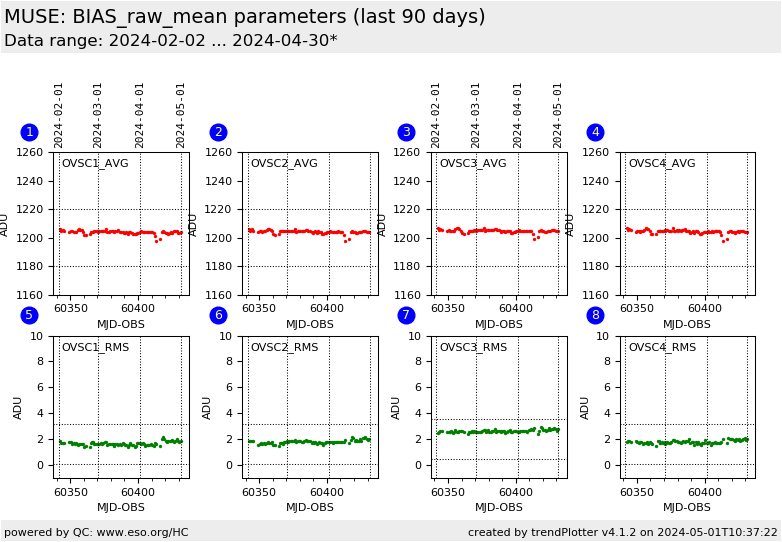
average over channels of Overscan value in Q1 |
| 2 |
• | QC1DB |
none |
|
ADU |
VAL | 1180.,1220. |
90 |
level2_mean |
this |
last_yr |
all
|
average over channels of Overscan value in Q2 |
| 3 |
• | QC1DB |
none |
|
ADU |
VAL | 1180.,1220. |
90 |
level3_mean |
this |
last_yr |
all
|
average over channels of Overscan value in Q3 |
| 4 |
• | QC1DB |
none |
|
ADU |
VAL | 1180.,1220. |
90 |
level4_mean |
this |
last_yr |
all
|
average over channels of Overscan value in Q4 |
| 5 |
• | QC1DB |
none |
|
ADU |
VAL | 0.10,3.20 |
90 |
level1_mean |
this |
last_yr |
all
|
rms of the average Overscan value in Q1 |
| 6 |
• | QC1DB |
none |
|
ADU |
VAL | 0.10,3.20 |
90 |
level2_mean |
this |
last_yr |
all
|
rms of the average Overscan value in Q2 |
| 7 |
• | QC1DB |
none |
|
ADU |
VAL | 0.50,3.60 |
90 |
level3_mean |
this |
last_yr |
all
|
rms of the average Overscan value in Q3 |
| 8 |
• | QC1DB |
none |
|
ADU |
VAL | 0.10,3.20 |
90 |
level4_mean |
this |
last_yr |
all
|
rms of the average Overscan value in Q4 |
| |
|
*Data sources: QC1DB: QC1 database; LOCAL: local data source
|
Plot 1
scores:  7| 7|
| | data source: | muse_bias
(QC1 database) |
| dataset: | level1_mean | • |
| average: | none |
| fixed thresholds: | 1180.0...1220.0 | ADU |
| N_data plotted: | 90 |
| [click plot for closeup] |
Plot 2
scores: 7|
| | data source: | muse_bias
(QC1 database) |
| dataset: | level2_mean | • |
| average: | none |
| fixed thresholds: | 1180.0...1220.0 | ADU |
| N_data plotted: | 90 |
| [click plot for closeup] |
Plot 3
scores: 7|
| | data source: | muse_bias
(QC1 database) |
| dataset: | level3_mean | • |
| average: | none |
| fixed thresholds: | 1180.0...1220.0 | ADU |
| N_data plotted: | 90 |
| [click plot for closeup] |
Plot 4
scores: 7|
| | data source: | muse_bias
(QC1 database) |
| dataset: | level4_mean | • |
| average: | none |
| fixed thresholds: | 1180.0...1220.0 | ADU |
| N_data plotted: | 90 |
| [click plot for closeup] |
Plot 5
scores: 7|
| | data source: | muse_bias
(QC1 database) |
| dataset: | level1_mean | • |
| average: | none |
| fixed thresholds: | 0.1...3.2 | ADU |
| N_data plotted: | 90 |
| [click plot for closeup] |
Plot 6
scores: 7|
| | data source: | muse_bias
(QC1 database) |
| dataset: | level2_mean | • |
| average: | none |
| fixed thresholds: | 0.1...3.2 | ADU |
| N_data plotted: | 90 |
| [click plot for closeup] |
Plot 7
scores: 7|
| | data source: | muse_bias
(QC1 database) |
| dataset: | level3_mean | • |
| average: | none |
| fixed thresholds: | 0.5...3.6 | ADU |
| N_data plotted: | 90 |
| [click plot for closeup] |
Plot 8
scores: 7|
| | data source: | muse_bias
(QC1 database) |
| dataset: | level4_mean | • |
| average: | none |
| fixed thresholds: | 0.1...3.2 | ADU |
| N_data plotted: | 90 |
| [click plot for closeup] |
This is MUSE BIAS_raw_mean health check plot. It shows the AVG
and RMS of the overscans over all detectors, as calculated from the raw BIAS frames.
The AVG and RMS values are calculated and plotted for each quadrant separately.
Only BIAS calibrations taken with the read out mode (DET.READ.CURNAME)
SCI1.0 are selected.
The BIAS calibration data are taken with template TPL.ID=MUSE_cal_bias
General information
Click on any of the plots to see a close-up version.
The latest date is indicated on top of the plot.
If configured,
- data points belonging to the latest date are specially marked
- statistical averages are indicated by a solid line, and thresholds by broken lines
- outliers are marked by a red asterisk. They are defined as data points outside the
threshold lines
- "aliens" (= data points outside the plot Y limits) are marked by a red arrow (↑ or ↓)
- you can download the data for each parameter set if the 'Data downloads' link shows up
|
