| | | NAOS has two
detectors for the adaptive optics subsystems. CONICA has one Aladdin
array, which is operated in the following read out modes :
Double_RdRstRd, Uncorr and FowlerNsamp. See the User Manual for
details. Our QC1 checks are on the CONICA Aladdin detector. -
PRODUCT_PLOT. This means that for
each dark pipeline product and its associated raw frames we create a
plot with the most significant features.
- PRODUCT DIFFERENCE FRAME. The
visual check includes the product frame, the difference between the
product to be checked and the last taken product with the same
instrument settings (= last coherent frame), and the difference with
the a reference frame, taken at the beginning of instrument
operations; which will be updated from time to time (e.g. once a year
or after major interventions).
- QC1 PARAMETER CROSS CHECK. This means
that selected QC1 parameters are compared wqith the kost recently
obtained QC1 parameter via Process Control Chart. We use simple
Shewhart Control charts for Individual Values.
- RELATION checks. This means that we associate
QC1 parameters with each other and check if they follow a certain
relation and we check if this relation is constant in
time.
- TRENDING. This means
that we store all qc1 parameters and build Run Charts which simply
show the parameter as a function of time over a larger time
interval.
NACO product files follow a certain naming
convention. | ![[top]](../img/arr1red-up.gif)
| PRODUCT PLOT
|
|
There follows for each dark product
type a QC1 plot. The first two are of the Hawaii array, the latter
three are of the Aladdin array. The Figure caption is equal for all
four plots.
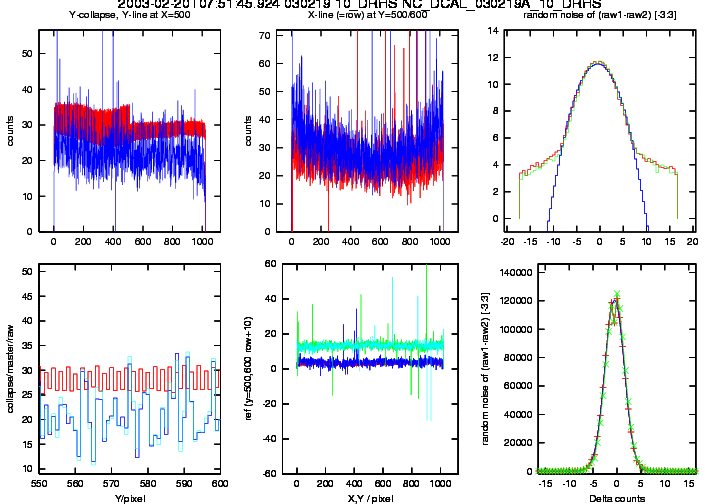
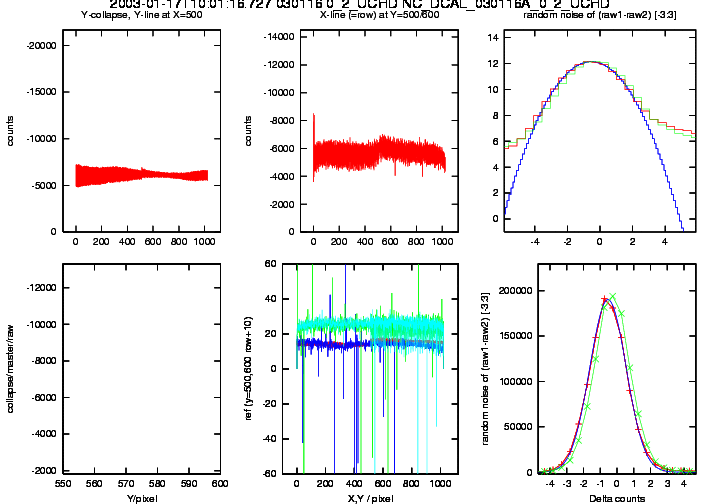
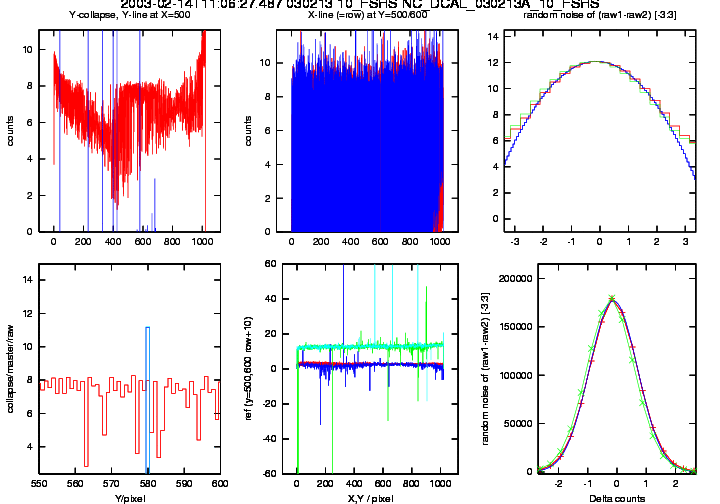
Figure
caption Upper left: the mean (collapsed) column and the column
at X=500 of the product frame. Upper middle : Two rows at Y=500 and
Y=600 of the product frame, Lower left: mean column (collapse), column
x=500 of the product and of the first of the three raw input
files. Lower Middel: The Y=500 row of the product minus the Y=500 row
of a reference product. Y=600 row of the product minus the Y=600 row
of a reference product. X=500 column of the master minus the X=500
column of a reference product. The reference product is renewed
usually once a period or after an intervention. Lower right: Histogram
of the difference frame (second raw minus first raw) (red) and
gaussian fit between -3 and 3 counts (blue). Histogram of the
raw3-raw2 difference frame (green). Upper right: As Lower right,
except a parabolic function (blue) is fit to the central part (-3 to 3
counts) of the log of the raw2-raw1 difference frame (red). Histogram
of the raw3-raw2 difference frame
(green). | | PRODUCT DIFFERENCE
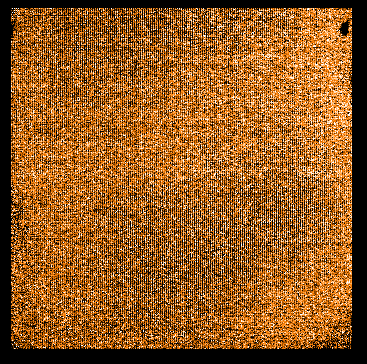
FRAMES | | | Difference frames are a quick look tool
to visualize structural changes within the detector, such as changes
in the fixed pattern noise, changes in the cold/hot pixel statistics
or large scale changes (e.g. contamination). |
|
TRENDIND
PLOTS | | |
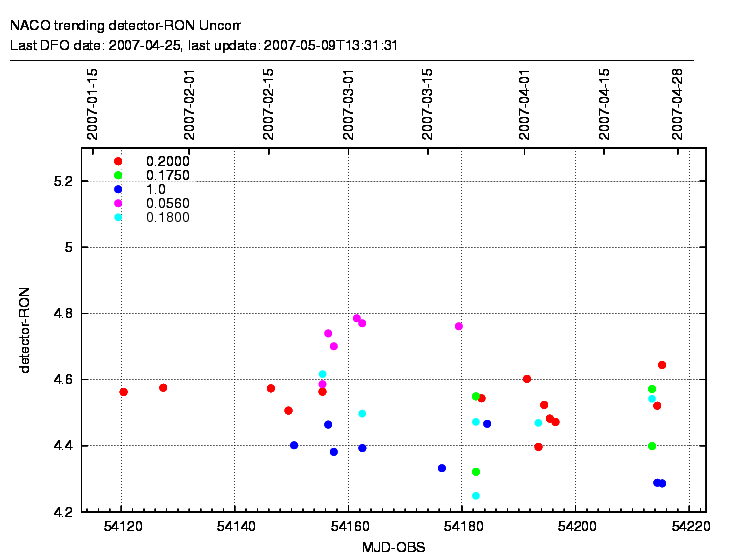
Trending describes the variation of a QC1 parameter over
longer period of time. We show a time range of 4 months and generate 4
trending plots a year. The following QC1 parameters are determined
and trended.
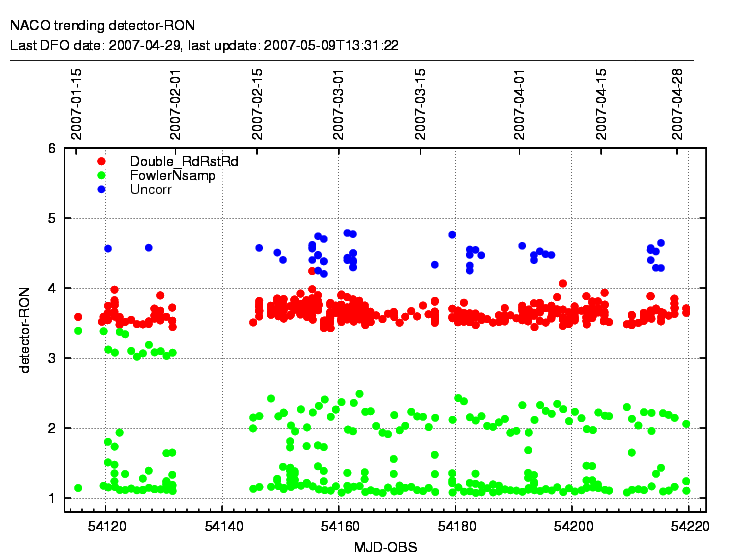
- Random noise as delivered by the dark-ron recipe
of the pipeline. The whole chip is characterized by one RON value
where the default parameters are used. These values are trended for
the most frequently used DITs. The following trending plot show:
RON values for each readout mode: dark_RON
(gif | ps)
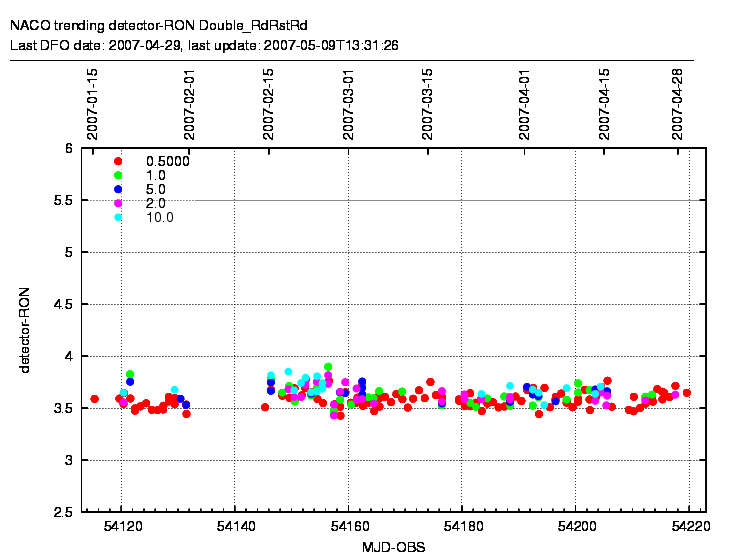
RON values for the Double_RdRstRd readout mode split by DIT:
dark_RON_DR
(gif | ps)
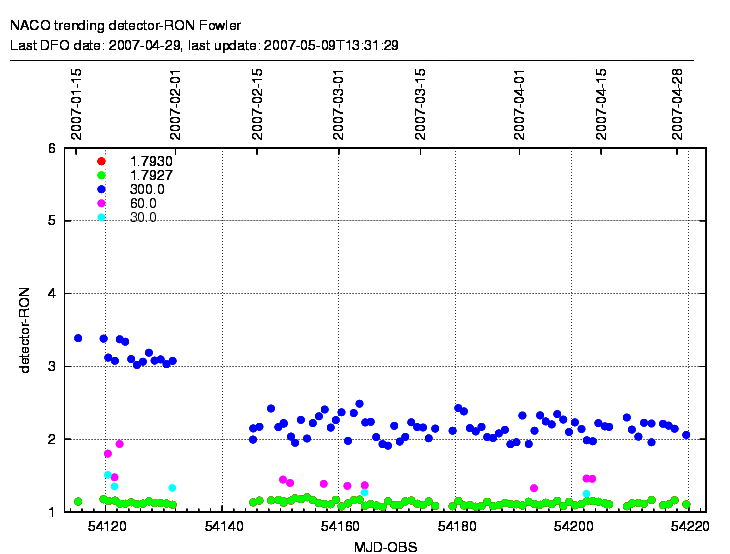
RON values for the FowlerNSamp readout mode split by DIT:
dark_RON_FS
(gif | ps)
RON values for the Uncorr readout mode split by DIT:
dark_RON_UC
(gif | ps)
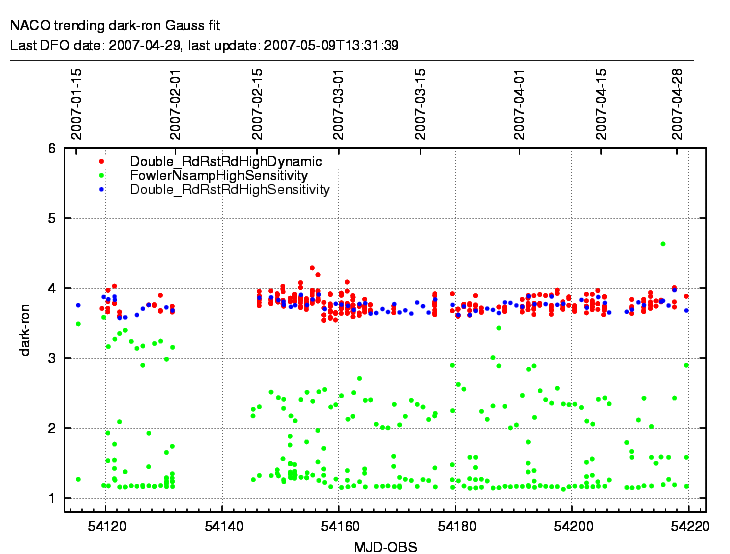
- Random noise as derived by a Gaussian fit to the histogram of the
raw input difference frame. This value seems to be more robust against the numerous
hot and cold pixels of the array. The trending plot shows RON for each readout
mode:
dark_GRON (gif
| ps)
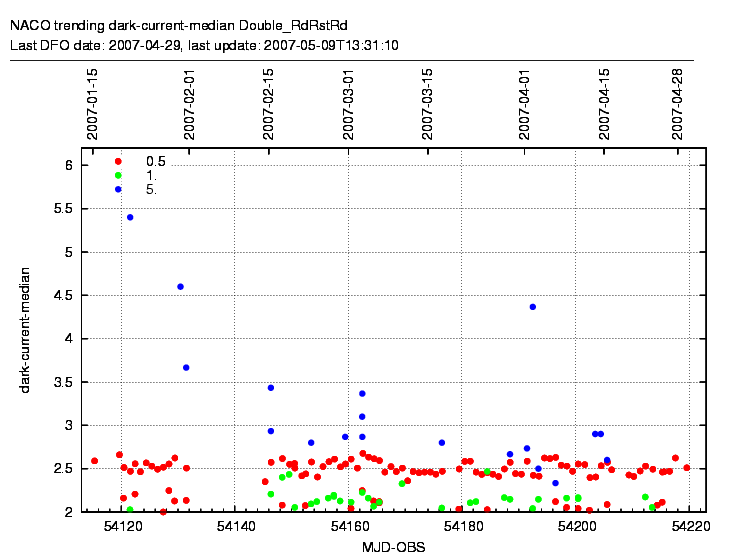
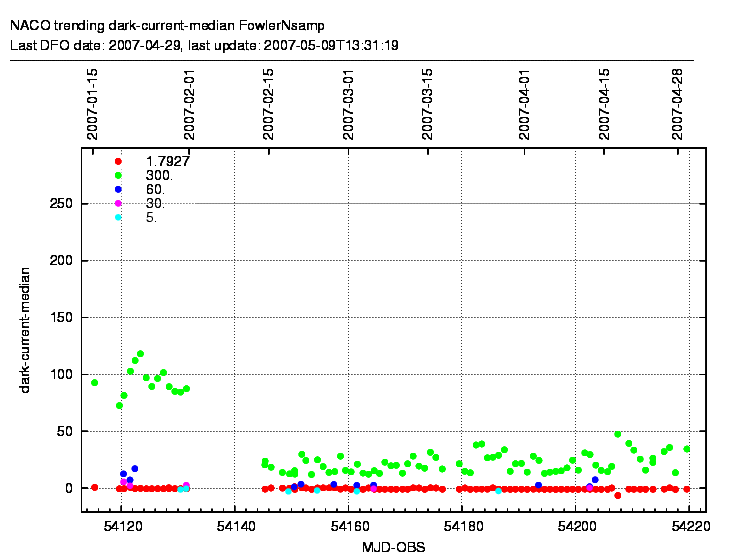
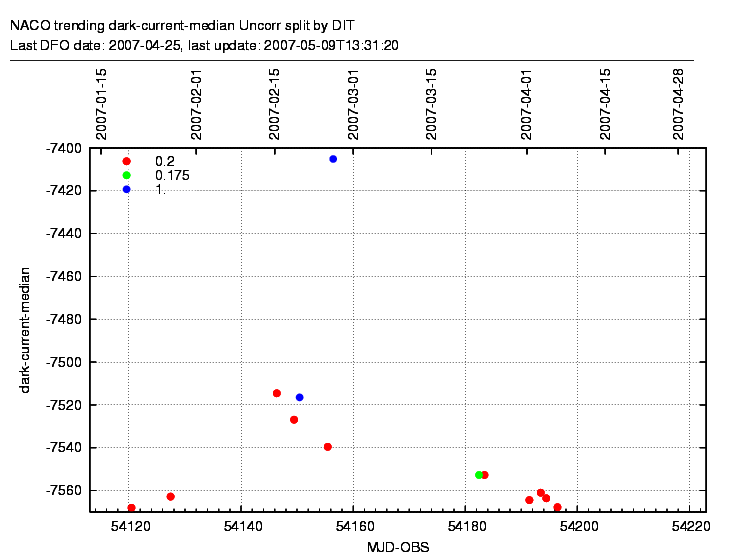
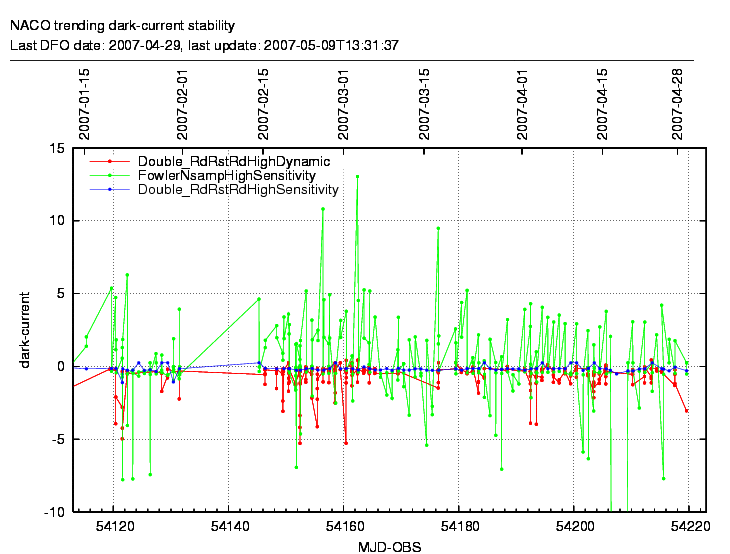
- Median
Dark level. Is taken from each product frame and is trended. The parameter
is derived from the product frame via the eclipse command stcube. There
is for each readout mode a trending plkot available, each one shows the dark current
for the most frequently used DITS:
dark_DoubRd (gif
| ps) dark_FowS
(gif | ps)
dark_Unco (gif
| ps)
-
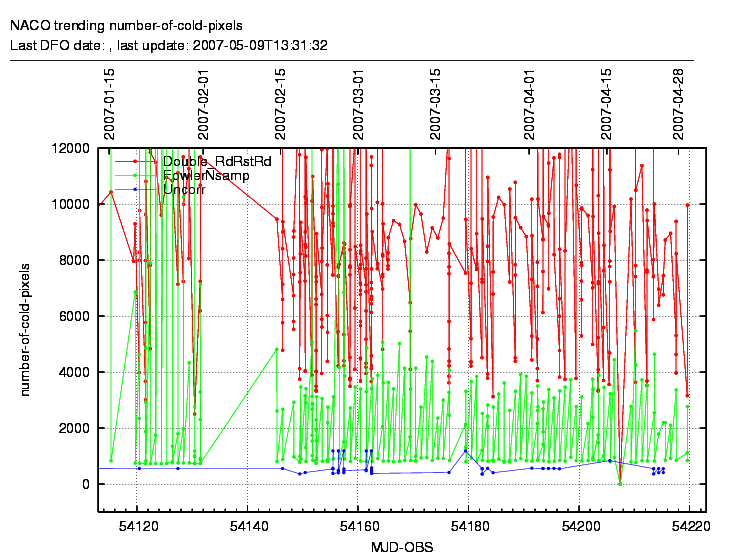
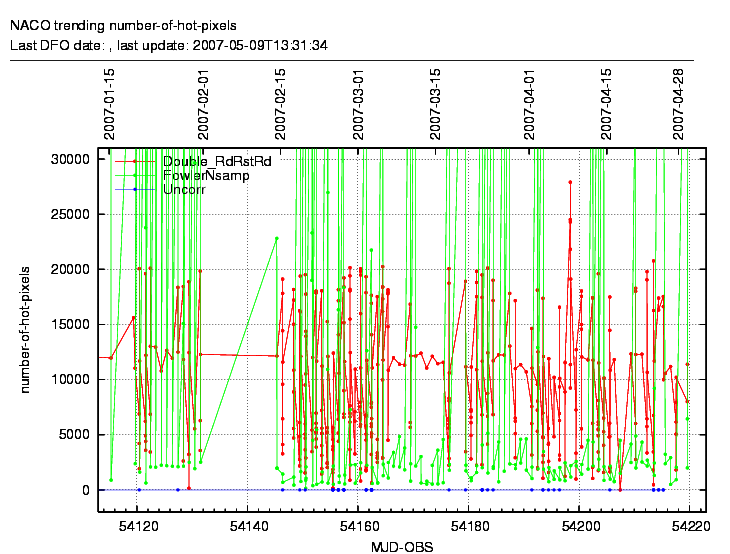
The number of hot/cold pixels is generated by an stcube over the
hot and cold pixel map as is generated by the naco pipeline dark command. We use
the default options (-b = 200, -t 6, 10), meaning, hot pixels are all pixels,
which deviate more than 10 sigma from the median and cold pixel deviate more than
6 sigma from the median. The median is taken from the central part of the frame
(a 200 pixel distance from the frame edges apply).
ColdPix
(gif | ps)
HotPix (gif
| ps)
-
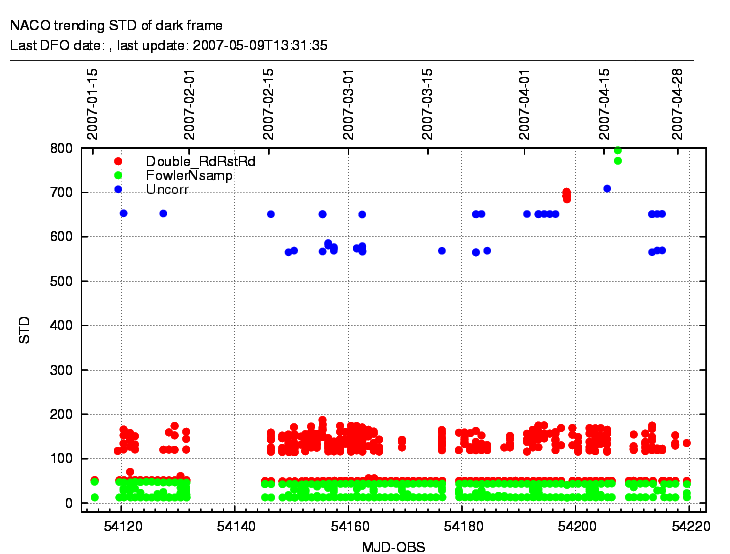
STD Is taken from each product frame and is trended. The parameter is
derived from the product frame via the eclipse command stcube
dark_STD
(gif | ps)
- DIFF is the dark level difference between
two consecetutive frames of the raw dark frame input list. This parameter showes
the short term stability of the dark current.
dark_DIFF
(gif | ps)
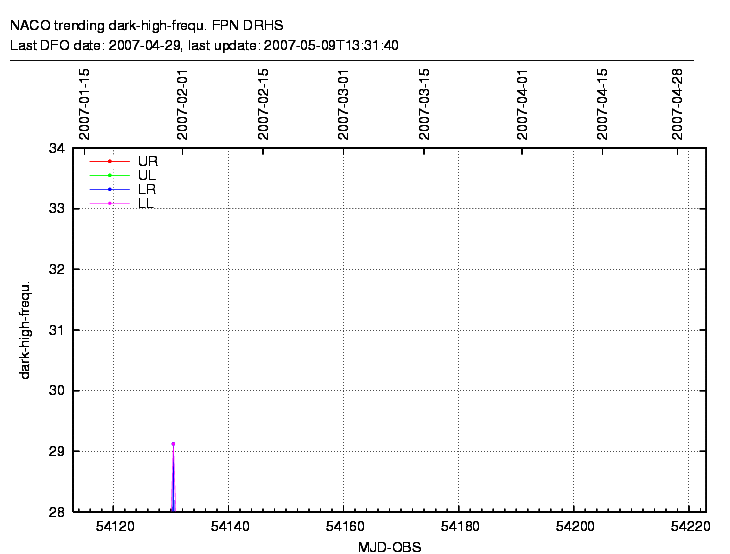
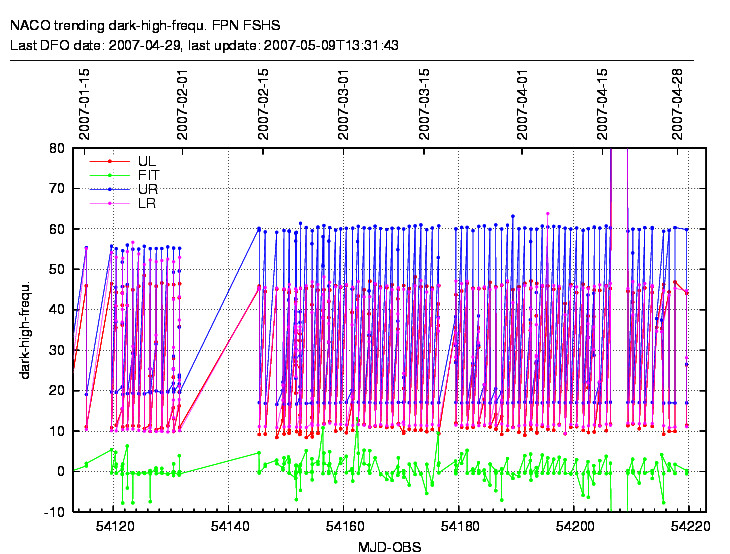
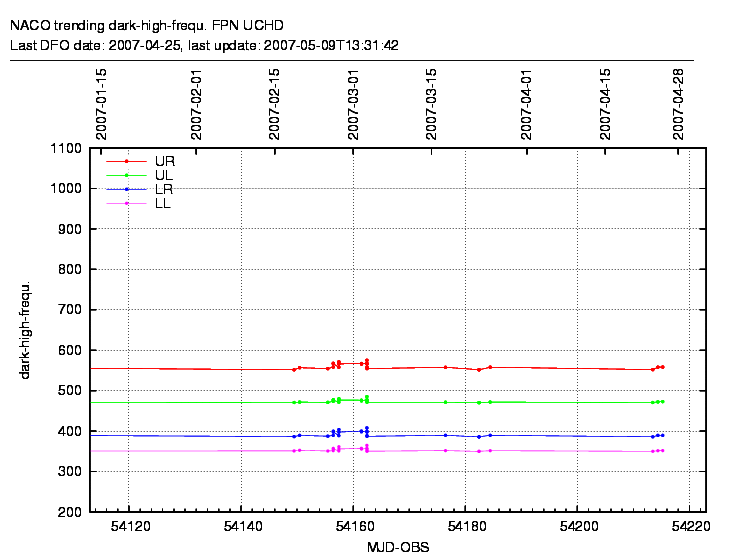
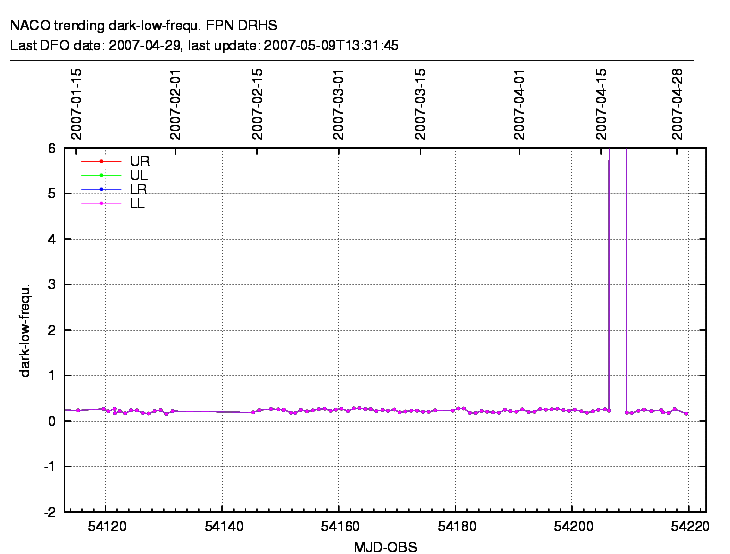
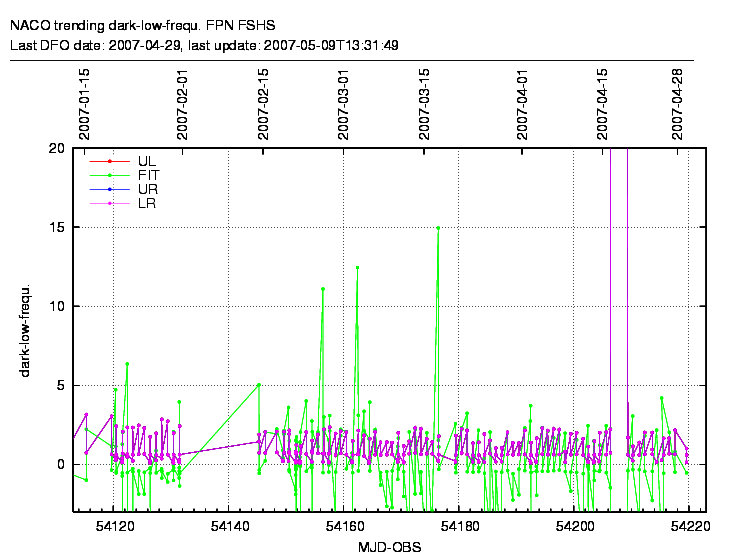
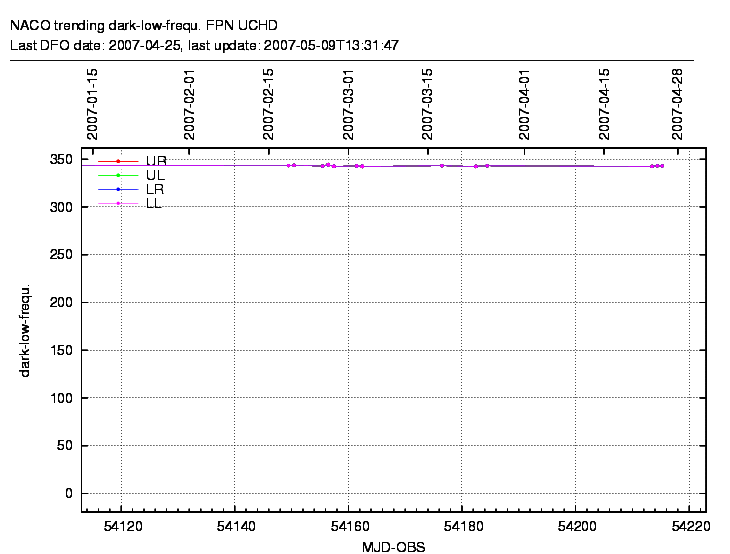
The following parameters are only trended but not part
of the Control Chart Scheme: - HFFPN_DRHS is the high frequency
fixed pattern noise for Double_RdRstRd. It containts the pixel to pixel variations
after a global gradient has been subtracted. The equivalent parameters are trended
for the two other read out modes HFFPN_FSHS and HFFPN_UCHD. LFFPN_DRHS
contains the low frequency fixed pattern noise in dark products which is e.g.
a large scale gradient. The equuivalent parameters are trended for Fowelsampling
and uncorrelated read out mode:.
The QC1 parameter GAIN,
a flux related fixed pattern noise are derived
from the lamp flat frames. |
|
| |
| |
