Plot
? |
Symb
? |
Source
* |
Average ? |
Thresholds ? |
N_
data |
QC1
parameter |
Data
downloads |
Remarks |
| method |
value |
unit |
method |
value |
| 1 |
• | QC1DB |
MEDIAN |
5.13 |
ADU |
VAL | 3,10 |
83 |
dark_ron12 |
this |
last_yr |
all
|
Double ReadResetRead DIT=0.5 |
| 2 |
• | QC1DB |
MEDIAN |
11.1 |
ADU |
VAL | 5,20 |
83 |
dark_ron12 |
this |
last_yr |
all
|
FowlerNSample DIT=300s |
| 3 |
• | QC1DB |
MEDIAN |
1.92 |
ADU |
VAL | 1.5,2.5 |
84 |
dark_ron12 |
this |
last_yr |
all
|
FowlerNSample DIT=1.7892s |
| 4 |
• | QC1DB |
MEDIAN |
26.7 |
ADU |
VAL | 20,40 |
83 |
dark_median |
this |
last_yr |
all
|
Double ReadResetRead DIT=0.5 |
| 5 |
• | QC1DB |
MEDIAN |
868 |
ADU |
VAL | 300,1400 |
83 |
dark_median |
this |
last_yr |
all
|
FowlerNSample DIT=300s |
| 6 |
• | QC1DB |
MEDIAN |
8.59 |
ADU |
VAL | 3,16 |
84 |
dark_median |
this |
last_yr |
all
|
FowlerNSample DIT=1.7892s |
| |
|
*Data sources: QC1DB: QC1 database; LOCAL: local data source
|
Plot 1
scores:  8| 8|
| | data source: | naco_dark
(QC1 database) |
| dataset: | dark_ron12 | • |
| median: | 5.13 | ADU |
| fixed thresholds: | 3...10 | ADU |
| N_data plotted: | 83 |
| [click plot for closeup] |
Plot 2
scores: 8|
| | data source: | naco_dark
(QC1 database) |
| dataset: | dark_ron12 | • |
| median: | 11.1 | ADU |
| fixed thresholds: | 5...20 | ADU |
| N_data plotted: | 83 |
| [click plot for closeup] |
Plot 3
scores: 8|
| | data source: | naco_dark
(QC1 database) |
| dataset: | dark_ron12 | • |
| median: | 1.92 | ADU |
| fixed thresholds: | 1.5...2.5 | ADU |
| N_data plotted: | 84 |
| [click plot for closeup] |
Plot 4
scores: 8|
| | data source: | naco_dark
(QC1 database) |
| dataset: | dark_median | • |
| median: | 26.7 | ADU |
| fixed thresholds: | 20...40 | ADU |
| N_data plotted: | 83 |
| [click plot for closeup] |
Plot 5
scores: 8|
| | data source: | naco_dark
(QC1 database) |
| dataset: | dark_median | • |
| median: | 868 | ADU |
| fixed thresholds: | 300...1400 | ADU |
| N_data plotted: | 83 |
| [click plot for closeup] |
Plot 6
scores: 8|
| | data source: | naco_dark
(QC1 database) |
| dataset: | dark_median | • |
| median: | 8.59 | ADU |
| fixed thresholds: | 3...16 | ADU |
| N_data plotted: | 84 |
| [click plot for closeup] |
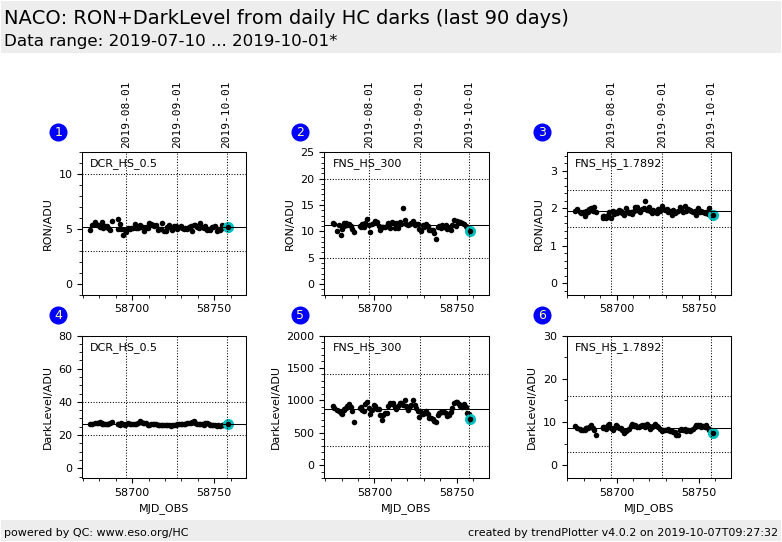
This plot shows the dark level and the readout noise for
three acquired dark calibration setups,
triggered by the daily HC batch (DET.NCORRS.NAME, DET.MODE.NAME, DET.DIT in sec).
Values with DET.WIN.NX = 1024 and DET.FRAM.TYPE = INT
are monitored only, meaning window read out mode and cube mode are excluded.
No selection on the camera (e.g. S13, S27, ...) is applied.
- Double_ReadResetRead, HighSensitivity, 0.5
- FowlerNsamp, HighSensitivity, 300.0
- FowlerNSamp, HighSensitivity, 1.7892
General information
Click on any of the plots to see a close-up version.
The latest date is indicated on top of the plot.
If configured,
- data points belonging to the latest date are specially marked
- statistical averages are indicated by a solid line, and thresholds by broken lines
- outliers are marked by a red asterisk. They are defined as data points outside the
threshold lines
- "aliens" (= data points outside the plot Y limits) are marked by a red arrow (↑ or ↓)
- you can download the data for each parameter set if the 'Data downloads' link shows up
|
