Plot
? |
Symb
? |
Source
* |
Average ? |
Thresholds ? |
N_
data |
QC1
parameter |
Data
downloads |
Remarks |
| method |
value |
unit |
method |
value |
| 1 |
• | QC1DB |
none |
|
NONE |
VAL | 0,2 |
10 |
vis12_avg |
this |
last_yr |
all
|
VIS2 Bas12 GRISM: High sensitivity |
| 2 |
• | QC1DB |
none |
|
NONE |
VAL | 0,2 |
10 |
vis13_avg |
this |
last_yr |
all
|
VIS2 Bas13 GRISM: High sensitivity |
| 3 |
• | QC1DB |
none |
|
NONE |
VAL | 0,2 |
10 |
vis14_avg |
this |
last_yr |
all
|
VIS2 Bas14 GRISM: High sensitivity |
| 4 |
• | QC1DB |
none |
|
NONE |
VAL | 0,2 |
10 |
vis23_avg |
this |
last_yr |
all
|
VIS2 Bas23 GRISM: High sensitivity |
| 5 |
• | QC1DB |
none |
|
NONE |
VAL | 0,2 |
10 |
vis24_avg |
this |
last_yr |
all
|
VIS2 Bas24 GRISM: High sensitivity |
| 6 |
• | QC1DB |
none |
|
NONE |
VAL | 0,2 |
10 |
vis34_avg |
this |
last_yr |
all
|
VIS2 Bas34 GRISM: High sensitivity |
|
| |
|
*Data sources: QC1DB: QC1 database; LOCAL: local data source
|
Plot 1
scores: not implemented
| | data source: | pionier_fringe_tech
(QC1 database) |
| dataset: | vis12_avg | • |
| average: | none |
| fixed thresholds: | 0...2 | NONE |
| N_data plotted: | 10 |
| [click plot for closeup] |
Plot 2
scores: not implemented
| | data source: | pionier_fringe_tech
(QC1 database) |
| dataset: | vis13_avg | • |
| average: | none |
| fixed thresholds: | 0...2 | NONE |
| N_data plotted: | 10 |
| [click plot for closeup] |
Plot 3
scores: not implemented
| | data source: | pionier_fringe_tech
(QC1 database) |
| dataset: | vis14_avg | • |
| average: | none |
| fixed thresholds: | 0...2 | NONE |
| N_data plotted: | 10 |
| [click plot for closeup] |
Plot 4
scores: not implemented
| | data source: | pionier_fringe_tech
(QC1 database) |
| dataset: | vis23_avg | • |
| average: | none |
| fixed thresholds: | 0...2 | NONE |
| N_data plotted: | 10 |
| [click plot for closeup] |
Plot 5
scores: not implemented
| | data source: | pionier_fringe_tech
(QC1 database) |
| dataset: | vis24_avg | • |
| average: | none |
| fixed thresholds: | 0...2 | NONE |
| N_data plotted: | 10 |
| [click plot for closeup] |
Plot 6
scores: not implemented
| | data source: | pionier_fringe_tech
(QC1 database) |
| dataset: | vis34_avg | • |
| average: | none |
| fixed thresholds: | 0...2 | NONE |
| N_data plotted: | 10 |
| [click plot for closeup] |
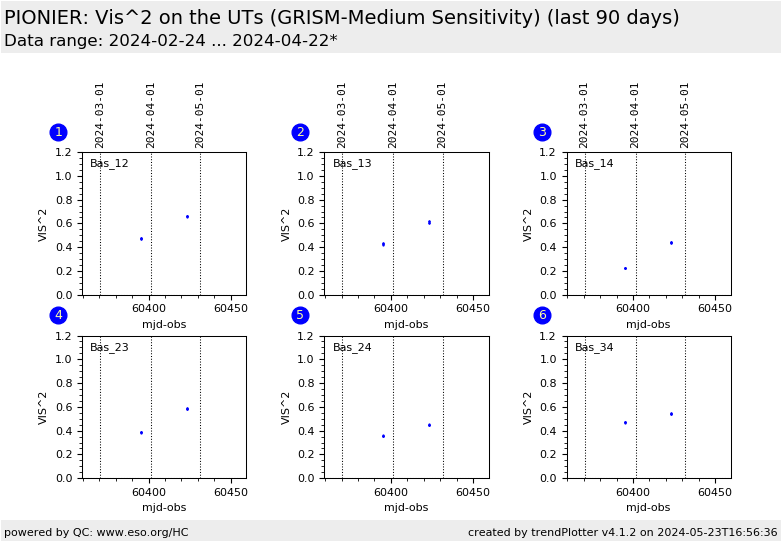
This is the trending plot using PIONIER QC parameters derived from CALIB_FRINGE frames.
calibrator catalog (if found)
.
Each of the plot represent the VIS^2 measured on one baseline.
For the ATs, the scatter of the measured VIS^2 could come from the atmosphere or from the fact that the telescope
positioned on a given station (1,2,3 or 4) could be different (AT1,2,3 or 4)
and the baseline length can also be very different
.
When the object is in the calibrator catalog, the TF is calculated and plotted
General information
Click on any of the plots to see a close-up version.
The latest date is indicated on top of the plot.
If configured,
- data points belonging to the latest date are specially marked
- statistical averages are indicated by a solid line, and thresholds by broken lines
- outliers are marked by a red asterisk. They are defined as data points outside the
threshold lines
- "aliens" (= data points outside the plot Y limits) are marked by a red arrow (↑ or ↓)
- you can download the data for each parameter set if the 'Data downloads' link shows up
|
