Plot
? |
Symb
? |
Source
* |
Average ? |
Thresholds ? |
N_
data |
QC1
parameter |
Data
downloads |
Remarks |
| method |
value |
unit |
method |
value |
| 1 |
o | QC1DB |
MEDIAN |
23.08142 |
ADU |
VAL | 2.5,300.0 |
34 |
qc_net_flux |
this |
last_yr |
all
|
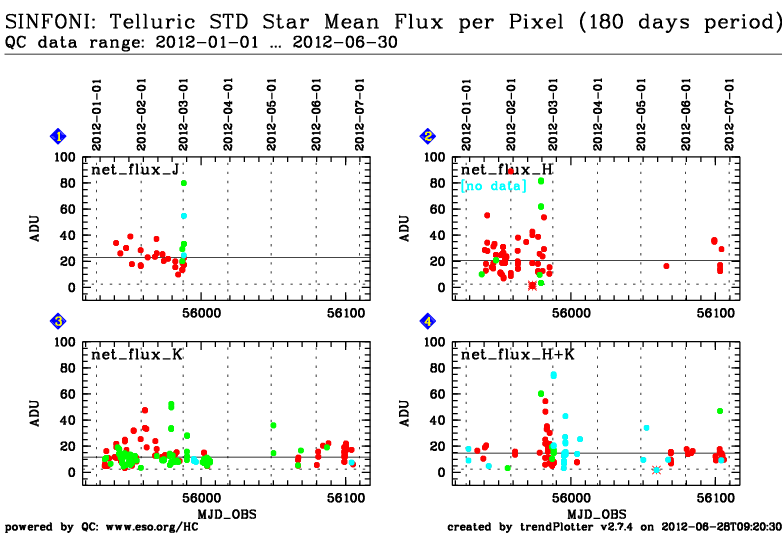
mean flux per pixel within a 3 sigma aperture in the J-band at all camera scales (ADU)
(this FULL data set is scored) |
| 1 |
• | QC1DB |
none |
|
ADU |
none | |
27 |
qc_net_flux |
this |
last_yr |
all
|
mean flux per pixel within a 3 sigma aperture: J-band/250 mas scale |
| 1 |
• | QC1DB |
none |
|
ADU |
none | |
5 |
qc_net_flux |
this |
last_yr |
all
|
mean flux per pixel within a 3 sigma aperture: J-band/100 mas scale |
| 1 |
• | QC1DB |
none |
|
ADU |
none | |
2 |
qc_net_flux |
this |
last_yr |
all
|
mean flux per pixel within a 3 sigma aperture: J-band/25 mas scale |
|
| 2 |
o | QC1DB |
MEDIAN |
20.69462 |
ADU |
VAL | 2.5,300.0 |
82 |
qc_net_flux |
this |
last_yr |
all
|
mean flux per pixel within a 3 sigma aperture in the H-band at all camera scales (ADU)
(this FULL data set is scored) |
| 2 |
• | QC1DB |
none |
|
ADU |
none | |
71 |
qc_net_flux |
this |
last_yr |
all
|
mean flux per pixel within a 3 sigma aperture: H-band/250 mas scale |
| 2 |
• | QC1DB |
none |
|
ADU |
none | |
11 |
qc_net_flux |
this |
last_yr |
all
|
mean flux per pixel within a 3 sigma aperture: H-band/100 mas scale |
| 2 |
• | QC1DB |
none |
|
ADU |
none | |
0 |
qc_net_flux |
this |
last_yr |
all
|
mean flux per pixel within a 3 sigma aperture: H-band/25 mas scale |
|
| 3 |
o | QC1DB |
MEDIAN |
11.53571 |
ADU |
VAL | 2.5,300.0 |
165 |
qc_net_flux |
this |
last_yr |
all
|
mean flux per pixel within a 3 sigma aperture in the K-band at all camera scales (ADU)
(this FULL data set is scored) |
| 3 |
• | QC1DB |
none |
|
ADU |
none | |
79 |
qc_net_flux |
this |
last_yr |
all
|
mean flux per pixel within a 3 sigma aperture: K-band/250 mas scale |
| 3 |
• | QC1DB |
none |
|
ADU |
none | |
82 |
qc_net_flux |
this |
last_yr |
all
|
mean flux per pixel within a 3 sigma aperture: K-band/100 mas scale |
| 3 |
• | QC1DB |
none |
|
ADU |
none | |
4 |
qc_net_flux |
this |
last_yr |
all
|
mean flux per pixel within a 3 sigma aperture: K-band/25 mas scale |
|
| 4 |
o | QC1DB |
MEDIAN |
14.75076 |
ADU |
VAL | 2.5,300.0 |
106 |
qc_net_flux |
this |
last_yr |
all
|
mean flux per pixel within a 3 sigma aperture in the H+K-band at all camera scales (ADU)
(this FULL data set is scored) |
| 4 |
• | QC1DB |
none |
|
ADU |
none | |
64 |
qc_net_flux |
this |
last_yr |
all
|
mean flux per pixel within a 3 sigma aperture: H+K-band/250 mas scale |
| 4 |
• | QC1DB |
none |
|
ADU |
none | |
13 |
qc_net_flux |
this |
last_yr |
all
|
mean flux per pixel within a 3 sigma aperture: H+K-band/100 mas scale |
| 4 |
• | QC1DB |
none |
|
ADU |
none | |
29 |
qc_net_flux |
this |
last_yr |
all
|
mean flux per pixel within a 3 sigma aperture: H+K-band/25 mas scale |
|
| |
|
*Data sources: QC1DB: QC1 database; LOCAL: local text file
|
| Plot 1 | | data source: | sinfoni_std
(QC1 database) |
dataset:
(numbers below apply to this dataset) | qc_net_flux | o |
| median: | 23.08142 | ADU |
| fixed thresholds: | 2.5...300.0 | ADU |
| N_data plotted: | 34 |
| [click on plot for closeup] |
| Plot 2 | | data source: | sinfoni_std
(QC1 database) |
dataset:
(numbers below apply to this dataset) | qc_net_flux | o |
| median: | 20.69462 | ADU |
| fixed thresholds: | 2.5...300.0 | ADU |
| N_data plotted: | 82 |
| [click on plot for closeup] |
| Plot 3 | | data source: | sinfoni_std
(QC1 database) |
dataset:
(numbers below apply to this dataset) | qc_net_flux | o |
| median: | 11.53571 | ADU |
| fixed thresholds: | 2.5...300.0 | ADU |
| N_data plotted: | 165 |
| [click on plot for closeup] |
| Plot 4 | | data source: | sinfoni_std
(QC1 database) |
dataset:
(numbers below apply to this dataset) | qc_net_flux | o |
| median: | 14.75076 | ADU |
| fixed thresholds: | 2.5...300.0 | ADU |
| N_data plotted: | 106 |
| [click on plot for closeup] |
These are the trending plots for the SINFONI QC parameters derived
from the telluric STD stars.
Telluric standard star monitoring has been implemented beginning 2009-05-01.
The intent is to monitor the MINIMUM flux of the STD star to insure that it has an adequate S/N.
Flux levels should be above 5 ADU/pixel within a 3 sigma aperture.
Find more information about SINFONI STD calibration data
here.
Other QC parameters are also trended
here.
General information
Click on any of the plots to see a close-up version.
The latest date is indicated on top of the plot, data points belonging to that date are specially marked.
If configured,
- statistical averages are indicated by a solid line, and thresholds by broken lines
- outliers are marked by a red asterisk. They are defined as data points outside the
threshold lines
- "aliens" (= data points outside the plot Y limits) are marked by a red arrow (↑ or ↓)
- you can download the data for each parameter set if the 'Data downloads' link shows up
|
