Telluric standard star observations are required for all near-infrared
spectroscopic observations in order to be able to remove the telluric
(atmospheric) absorption features in the data. Telluric standards are not
standard stars in the classical sense; they are simply bright stars of known
spectral type for which the intrinsic stellar features are either negligible
or easily separated from features introduced by the earth's atmosphere. The
telluric standard star is usually taken directly after the science spectrum
with the same spectroscopic setup and the same average airmass of the target,
in order to avoid significant changes in the shape and intensity of the
telluric absorption lines. When the science target is reduced with the same
spectroscopic flat as the telluric standard star, the lamp features cancel
out. The standard star data is processed with the same pipeline routine as is
used for science frames. Telluric standard star products are stand-alone
deliverables; the pipeline does not correct the science spectra for telluric
absorption features.
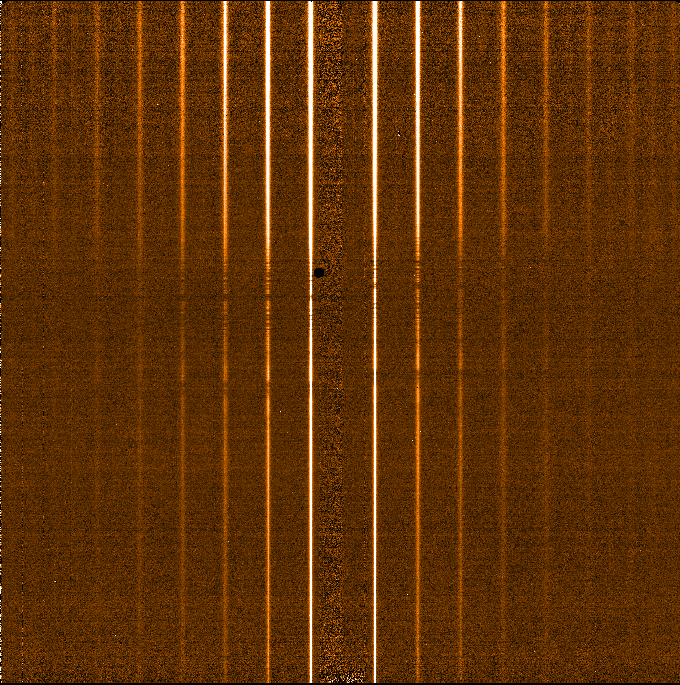
This is a stack of N telluric STD star frames before being combined into a cube (STD_NODDING_STACKED).
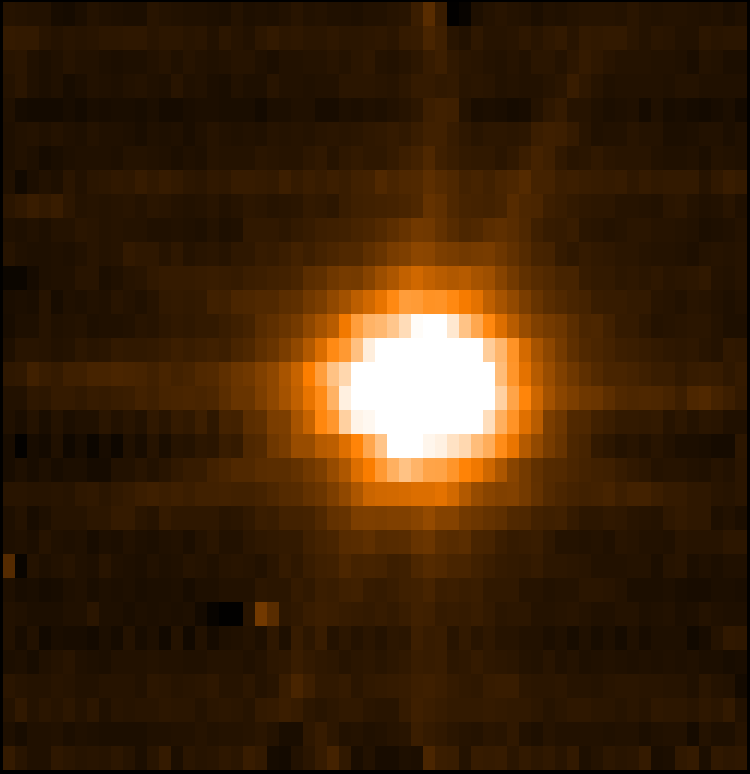
Median collapse of a telluric STD reconstructed cube (MED_COADD_STD).
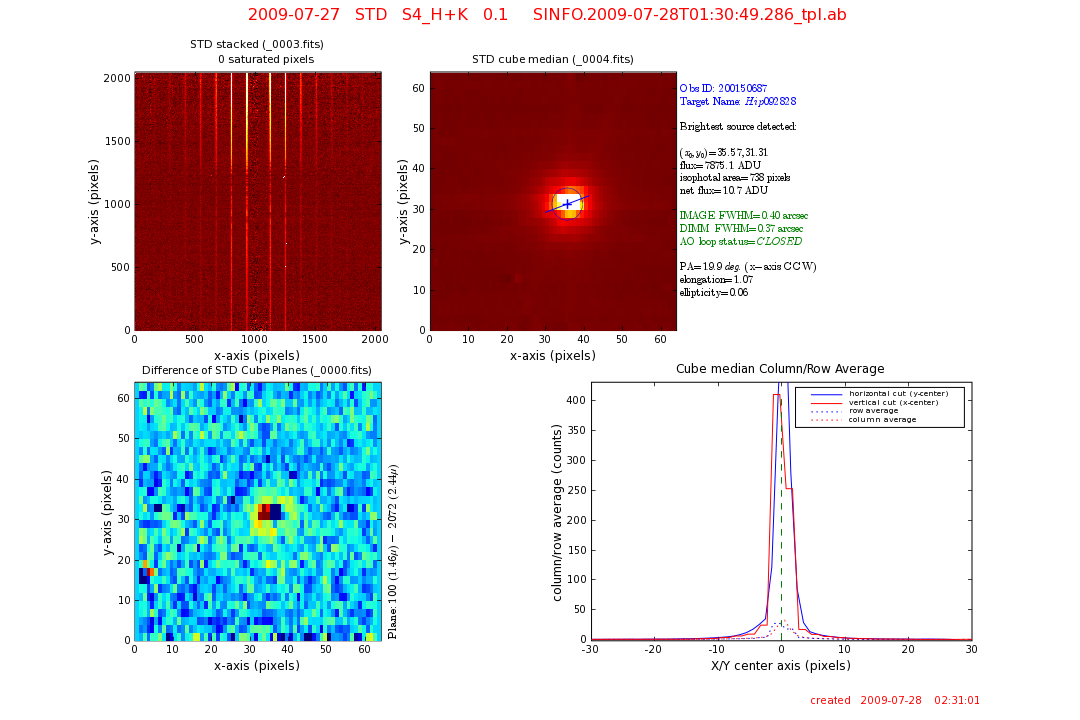
UL: the STD_NODDING_STACKED full detector intermediate product image with the number of saturated pixels listed.
UR: the MED_COADD_STD median cube collapsed image. A number of paramters are listed: the Obs ID, the target name, and for the brightest source detected:
source center (pixels), the integrated flux (within 3 sigma), the isophotal area (3 sigma), the net flux per pixel, the image FWHM (arcsec), the DIMM seeing corrected for the same airmass and filter used by this standard star, the status of the AO loop (OPEN or CLOSED), the position angle of the brightest source (degrees CCW from the x-axis), and its elongation and ellipticity. The source center, its position angle, and its FWHM are marked on the image.
LL: the (scaled) difference between two cube planes. Plane 100 - Plane 2072. The wavelengths of these planes are listed to the right of this image.
LR: a horizontal (blue line) and vertical (red line) cut through the center of the brightest detected source of the MED_COADD_STD median cube collapsed image. The respective averages through this center are shown as dotted lines.
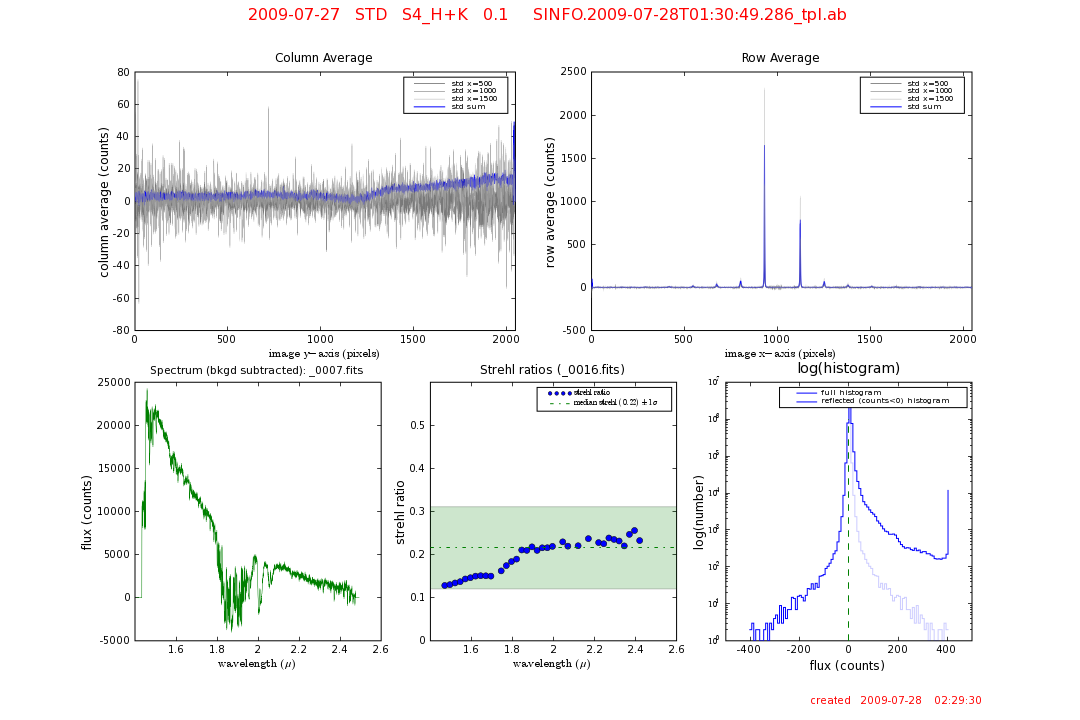
QC Report 2:
UL: three single column traces of the current product (STD_NODDING_STACKED) through: x = 500 (dark grey), x = 1000 (middle grey), x = 1500 (light grey) and an averaged sum of all columns (blue).
UR: three single row traces of the current product (STD_NODDING_STACKED) through: x = 500 (dark grey), x = 1000 (middle grey), x = 1500 (light grey) and an averaged sum of all rows (blue).
LL: the background-subtracted standard star spectrum (STD_STAR_SPECTRA) extracted by the pipeline.
LC: the strehl ratio as a function of wavelength (microns). The median strehl ratio (dotted green line) and the area denoting the 1 sigma strehl ratio (shaded green area) are shown.
LR: a logarithmic histogram of the STD_NODDING_STACKED full detector image is shown as a dark blue line, while the reflection of the non-positive flux histogram is shown in light blue.
QC report 1.
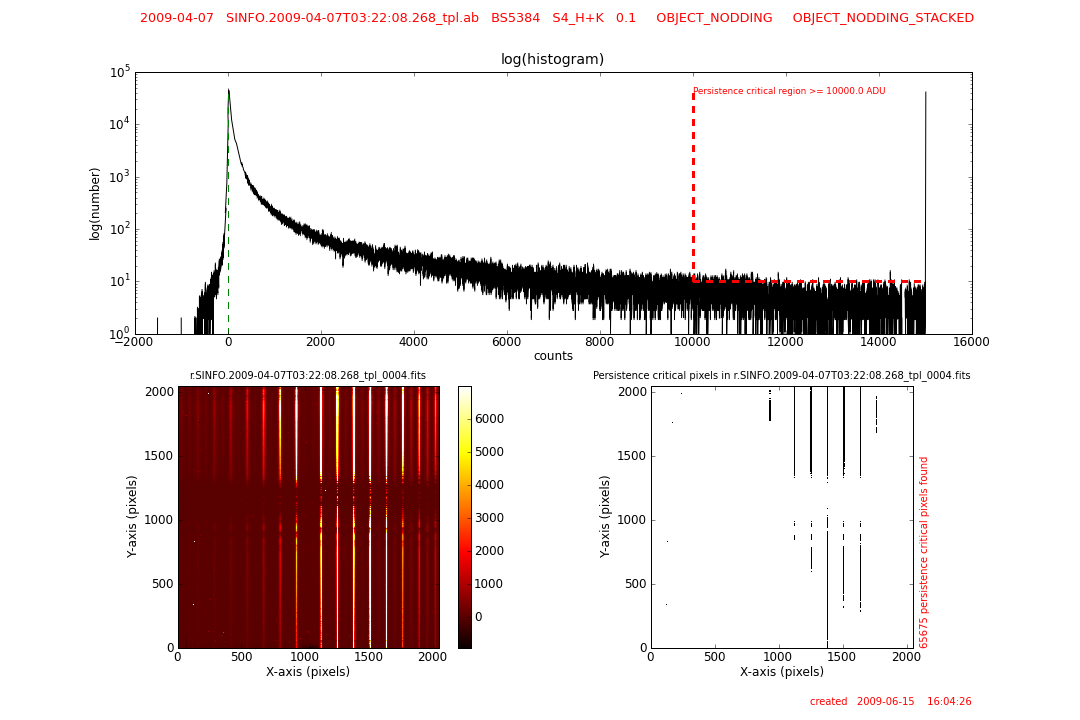
QC Report 3
TOP: a logarithmic histogram of the STD_NODDING_STACKED full detector science image with the persistence critical region shown as a red dotted line.
LL: the STD_NODDING_STACKED full detector intermediate product image.
LR: an estimate of the location of possible persistence critical pixels.
SExtractor (Bertin and Arnouts 1996 A&A 117,393) is run on the MED_COADD_STD frame and the brightest detected source is assumed to be the STD.
The total flux integrated over a 3 sigma detection aperture is divided by the number of pixels in this aperture.
This "net" flux per pixel is monitored for all filters and pixel scales. Values above 5 ADU/pixel are considered acceptable.
For each plane (wavelength step) in the COADD_STD cube the pipeline computes the strehl ratio of the STD star. The median value over all cube planes is monitored for all filters and pixel scales.
test for over-flux
A histogram is created from the STD_NODDING_STACKED image. If there are more than 10 instances of 6 or more contiguous pixels having count levels above 10,000 ADU, then this frame is in danger of persistence. In this case qc.persist.danger = 1, otherwise it is set to 0. If a danger of persistence is detected, the number of affected pixels is also given (qc.Npersist).
image quality (J-band)
The QC_script then calculates a Delta_IQ = sinfoni telluric standard star FWHM - DIMM seeing (whereby the DIMM seeing has been adjusted to the wavelength and airmass of the standard star observation). The image quality (IQ) plot shows the FWHM of the STD star and the corrected DIMM plotted against one another. CLOSED loop (AO) observations are plotted as solid circles, while OPEN loop (non-AO) observations are shown as open circles (J-band with all pixel scales).
NOTE: The conversion from pixels to arcsec for the image FWHM takes into account the fact that the reconstructed SINFONI cube has rectangular pixels. The reconstructed pixels are such that on-sky Delta_X = 0.5*Delta_Y. The correct conversion, in terms of the source position angle (PA), is:
pixel_scale is given by the keyword INS.OPTI1.NAME
 Parameters trended