| Plot 1 | | data source: | sinfoni_psf
(QC1 database) |
dataset:
(numbers below apply to this dataset) | qc_net_flux | o |
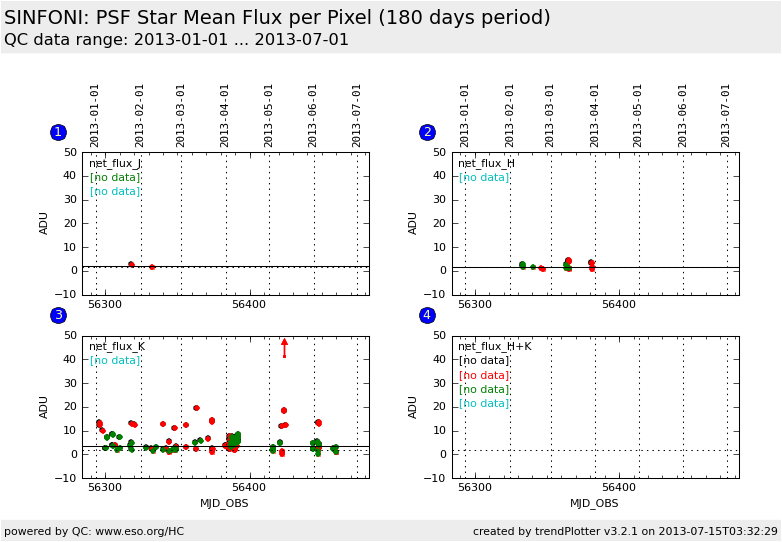
| median: | 2.07 | ADU |
| fixed thresholds: | 1.8...300.0 | ADU |
| N_data plotted: | 2 |
| [click on plot for closeup] |
| Plot 2 | | data source: | sinfoni_psf
(QC1 database) |
dataset:
(numbers below apply to this dataset) | qc_net_flux | o |
| median: | 1.71 | ADU |
| fixed thresholds: | 1.8...300.0 | ADU |
| N_data plotted: | 18 |
| [click on plot for closeup] |
| Plot 3 | | data source: | sinfoni_psf
(QC1 database) |
dataset:
(numbers below apply to this dataset) | qc_net_flux | o |
| median: | 3.66 | ADU |
| fixed thresholds: | 1.8...300.0 | ADU |
| N_data plotted: | 132 |
| [click on plot for closeup] |
| Plot 4 | | data source: | sinfoni_psf
(QC1 database) |
dataset:
(numbers below apply to this dataset) | qc_net_flux | o |
| median: | no data | ADU |
| fixed thresholds: | 1.8...300.0 | ADU |
| N_data plotted: | 0 |
| [click on plot for closeup] |
These are the trending plots for the SINFONI QC parameters derived from the PSF calibration frames.
PSF standard star monitoring has been implemented beginning 2009-05-01.
The intent is to monitor the MINIMUM flux of the PSF star to insure that it has an adequate S/N.
Flux levels should be above 3 ADU/pixel within a 3 sigma aperture for the K and H+K-band.
In the case of the J and H-band PSF stars, the minimum allowed flux level is 2 ADU/pixel within a 3 sigma aperture.
The PSF standard star is often used to test the centering of science
exposures. Therefore, we monitor the radial offset from the nominal field
center: R = sqrt[ (x-x0)^2 + (y-y0)^2 ].
Find more information about SINFONI PSF calibration data
here.
Other QC parameters are also trended
here.
General information
Click on any of the plots to see a close-up version.
The latest date is indicated on top of the plot, data points belonging to that date are specially marked.
If configured,
- statistical averages are indicated by a solid line, and thresholds by broken lines
- outliers are marked by a red asterisk. They are defined as data points outside the
threshold lines
- "aliens" (= data points outside the plot Y limits) are marked by a red arrow (↑ or ↓)
- you can download the data for each parameter set if the 'Data downloads' link shows up
|
