Plot
? |
Symb
? |
Source
* |
Average ? |
Thresholds ? |
N_
data |
QC1
parameter |
Data
downloads |
Remarks |
| method |
value |
unit |
method |
value |
| 1 |
• | QC1DB |
none |
|
arcsec |
none | |
100 |
qc_fwhm_sinfo |
this |
last_yr |
all
|
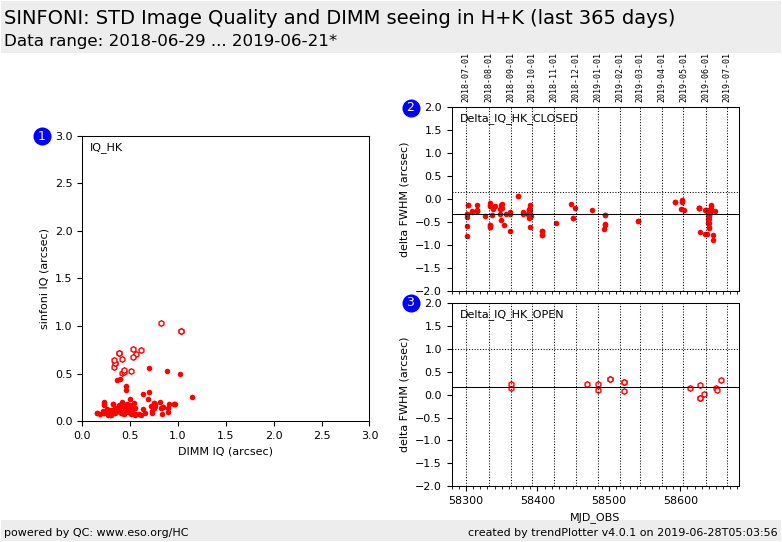
sinfoni STD fwhm vs. corrected DIMM seeing (arcsec) with line of equivalence plotted [H+K-band].
CLOSED loop AO. |
| 1 |
o | QC1DB |
none |
|
arcsec |
none | |
18 |
qc_fwhm_sinfo |
this |
last_yr |
all
|
sinfoni STD fwhm vs. corrected DIMM seeing (arcsec) with line of equivalence plotted [H+K-band].
OPEN loop AO. |
| 2 |
• | QC1DB |
MEDIAN |
-0.32 |
arcsec |
VAL | -1000.0,0.15 |
100 |
qc_delta_fwhm |
this |
last_yr |
all
|
delta FWHM = (sinfoni STD fwhm - corrected DIMM seeing) (arcsec) [H+K-band].
CLOSED loop AO. This data set is scored! |
| 3 |
o | QC1DB |
MEDIAN |
0.176 |
arcsec |
VAL | -1000.0,1.0 |
18 |
qc_delta_fwhm |
this |
last_yr |
all
|
delta FWHM = (sinfoni STD fwhm - corrected DIMM seeing) (arcsec) [H+K-band].
OPEN loop non-AO. This data set is scored! |
| |
|
*Data sources: QC1DB: QC1 database; LOCAL: local data source
|
Plot 1
scores: not implemented
| | data source: | sinfoni_std
(QC1 database) |
dataset:
(numbers below apply to this dataset) | qc_fwhm_sinfo | • |
| average: | none |
| thresholds: | none |
| N_data plotted: | 100 |
| [click plot for closeup] |
Plot 2
scores:  8| 8|
| | data source: | sinfoni_std
(QC1 database) |
| dataset: | qc_delta_fwhm | • |
| median: | -0.32 | arcsec |
| fixed thresholds: | -1000.0...0.15 | arcsec |
| N_data plotted: | 100 |
| [click plot for closeup] |
Plot 3
scores: 3|
| | data source: | sinfoni_std
(QC1 database) |
| dataset: | qc_delta_fwhm | o |
| median: | 0.176 | arcsec |
| fixed thresholds: | -1000.0...1.0 | arcsec |
| N_data plotted: | 18 |
| [click plot for closeup] |
These are the trending plots for the SINFONI QC parameters defined for
the image quality as measured for the telluric standard stars
(H+K-band / all pixel scales).
Plot #1 is a one-to-one comparison of the image quality achieved by
SINFONI and the seeing as measured by the DIMM
site-monitor. The DIMM seeing has been adjusted to the wavelength and
airmass of the standard star observation. The image quality (IQ) plot
shows the FWHM of the STD star and the corrected DIMM plotted against
one another. CLOSED loop (AO) observations are plotted as solid
circles, while OPEN loop (non-AO) observations are shown as open circles.
Plot #2 shows Delta_IQ = sinfoni telluric standard star FWHM - DIMM
seeing for all observations with SINFONI in CLOSED loop mode.
This parameter is scored.
Plot #3 shows Delta_IQ = sinfoni telluric standard star FWHM - DIMM
seeing for all observations with SINFONI in OPEN loop mode.
This parameter is scored.
NOTE: The conversion from pixels to arcsec for the image FWHM
takes into account the fact that the reconstructed SINFONI cube has
rectangular pixels. The reconstructed pixels are such that on-sky
Delta_X = 0.5*Delta_Y.
The correct conversion, in terms of the source position angle (PA), is given by:
 the pixel_scale is given by the keyword INS.OPTI1.NAME.
Find more information about SINFONI STD calibration data
here.
Other QC parameters are also trended
here.
General information
Click on any of the plots to see a close-up version.
The latest date is indicated on top of the plot.
If configured,
- data points belonging to the latest date are specially marked
- statistical averages are indicated by a solid line, and thresholds by broken lines
- outliers are marked by a red asterisk. They are defined as data points outside the
threshold lines
- "aliens" (= data points outside the plot Y limits) are marked by a red arrow (↑ or ↓)
- you can download the data for each parameter set if the 'Data downloads' link shows up
|
