Plot
? |
Symb
? |
Source
* |
Average ? |
Thresholds ? |
N_
data |
QC1
parameter |
Data
downloads |
Remarks |
| method |
value |
unit |
method |
value |
| 1 |
• | QC1DB |
MEDIAN |
24281.5 |
ADU |
VAL | 15000,28000 |
22 |
qc_num_hotpix |
this |
last_yr |
all
|
DIT=2, NDIT=40, Nondest |
| 2 |
• | QC1DB |
MEDIAN |
36741 |
ADU |
VAL | 25000,45000 |
22 |
qc_num_hotpix |
this |
last_yr |
all
|
DIT=8, NDIT=25, Nondest |
| 3 |
• | QC1DB |
MEDIAN |
54757.5 |
ADU |
VAL | 40000,60000 |
22 |
qc_num_hotpix |
this |
last_yr |
all
|
DIT=30, NDIT=15, Nondest |
| 4 |
• | QC1DB |
none |
|
degree |
none | |
287 |
qc_num_hotpix |
this |
last_yr |
all
|
IFS detector temperature, INS2.TEMP201.VAL |
| |
|
*Data sources: QC1DB: QC1 database; LOCAL: local data source
|
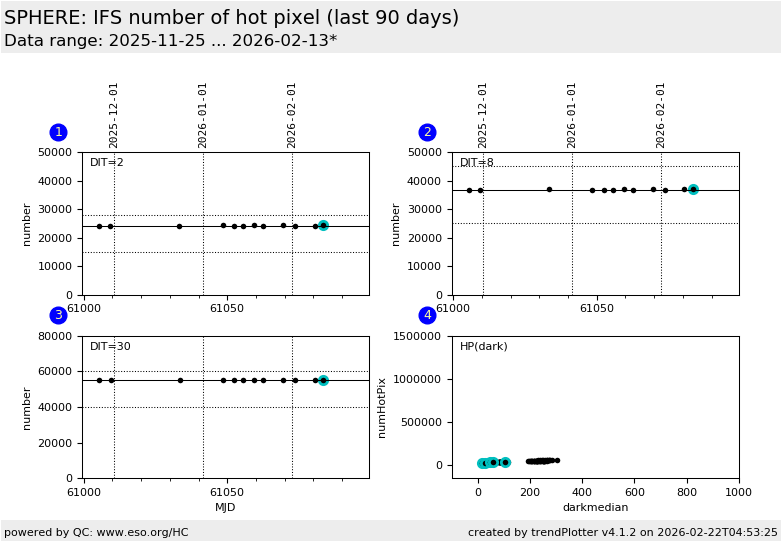
Plot 1
scores:  3| 3|
| | data source: | sphere_ifs_dark
(QC1 database) |
| dataset: | qc_num_hotpix | • |
| median: | 24281.5 | ADU |
| fixed thresholds: | 15000...28000 | ADU |
| N_data plotted: | 22 |
| [click plot for closeup] |
Plot 2
scores: 3|
| | data source: | sphere_ifs_dark
(QC1 database) |
| dataset: | qc_num_hotpix | • |
| median: | 36741 | ADU |
| fixed thresholds: | 25000...45000 | ADU |
| N_data plotted: | 22 |
| [click plot for closeup] |
Plot 3
scores: 3|
| | data source: | sphere_ifs_dark
(QC1 database) |
| dataset: | qc_num_hotpix | • |
| median: | 54757.5 | ADU |
| fixed thresholds: | 40000...60000 | ADU |
| N_data plotted: | 22 |
| [click plot for closeup] |
Plot 4
scores: not implemented
| | data source: | sphere_ifs_dark
(QC1 database) |
| dataset: | qc_num_hotpix | • |
| average: | none |
| thresholds: | none |
| N_data plotted: | 287 |
| [click plot for closeup] |
This plot monitors QC parameter NumberOfHotPixel of the IFS-arm
for a selected range of DIT
derived from SPHERE_irdifs_cal_dark template
and processed by the sph_isf_dark recipe.
Lower right plot: Number of bad pixel as a function of dark level.
General information
Click on any of the plots to see a close-up version.
The latest date is indicated on top of the plot.
If configured,
- data points belonging to the latest date are specially marked
- statistical averages are indicated by a solid line, and thresholds by broken lines
- outliers are marked by a red asterisk. They are defined as data points outside the
threshold lines
- "aliens" (= data points outside the plot Y limits) are marked by a red arrow (↑ or ↓)
- you can download the data for each parameter set if the 'Data downloads' link shows up
|
