Plot
? |
Symb
? |
Source
* |
Average ? |
Thresholds ? |
N_
data |
QC1
parameter |
Data
downloads |
Remarks |
| method |
value |
unit |
method |
value |
| 1 |
• | QC1DB |
none |
|
ADU |
none | |
22 |
qc_persistence |
this |
last_yr |
all
|
setup: DIT=2, NDIT=40, Nondest |
| 2 |
• | QC1DB |
none |
|
ADU |
none | |
9 |
qc_persistence |
this |
last_yr |
all
|
setup: DIT=4, NDIT=20, Nondest |
| 3 |
• | QC1DB |
none |
|
ADU |
none | |
22 |
qc_persistence |
this |
last_yr |
all
|
setup: DIT=8, NDIT=25, Nondest |
| 4 |
• | QC1DB |
none |
|
ADU |
none | |
6 |
qc_persistence |
this |
last_yr |
all
|
setup: DIT=16, NDIT=20, Nondest |
| 5 |
• | QC1DB |
none |
|
ADU |
none | |
22 |
qc_persistence |
this |
last_yr |
all
|
setup: DIT=30, NDIT=15, Nondest |
| 6 |
• | QC1DB |
none |
|
ADU |
none | |
4 |
qc_persistence |
this |
last_yr |
all
|
setup: DIT=64, NDIT=20, Nondest |
| |
|
*Data sources: QC1DB: QC1 database; LOCAL: local data source
|
Plot 1
scores: not implemented
| | data source: | sphere_ifs_background
(QC1 database) |
| dataset: | qc_persistence | • |
| average: | none |
| thresholds: | none |
| N_data plotted: | 22 |
| [click plot for closeup] |
Plot 2
scores: not implemented
| | data source: | sphere_ifs_background
(QC1 database) |
| dataset: | qc_persistence | • |
| average: | none |
| thresholds: | none |
| N_data plotted: | 9 |
| [click plot for closeup] |
Plot 3
scores: not implemented
| | data source: | sphere_ifs_background
(QC1 database) |
| dataset: | qc_persistence | • |
| average: | none |
| thresholds: | none |
| N_data plotted: | 22 |
| [click plot for closeup] |
Plot 4
scores: not implemented
| | data source: | sphere_ifs_background
(QC1 database) |
| dataset: | qc_persistence | • |
| average: | none |
| thresholds: | none |
| N_data plotted: | 6 |
| [click plot for closeup] |
Plot 5
scores: not implemented
| | data source: | sphere_ifs_background
(QC1 database) |
| dataset: | qc_persistence | • |
| average: | none |
| thresholds: | none |
| N_data plotted: | 22 |
| [click plot for closeup] |
Plot 6
scores: not implemented
| | data source: | sphere_ifs_background
(QC1 database) |
| dataset: | qc_persistence | • |
| average: | none |
| thresholds: | none |
| N_data plotted: | 4 |
| [click plot for closeup] |
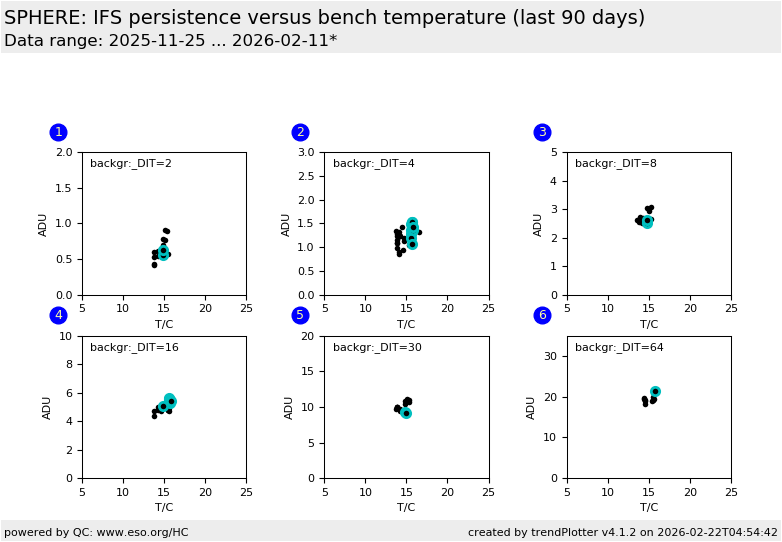
This plot monitors the persistence in IFS background calibrations
which can be generated by previously acquired IFS optical distortion calibrations.
These optical distortion calibrations can leave a pinhole slice pattern in the IFS background pipeline product.
The QC parameter is simply: the median counts in the pipeline product in a window P = [770, 130 --- 850, 1440]
minus the median counts in window B = [640, 1470 --- 720, 1570].
Window P (pinhole) is the area where the pinhole slice pattern can show up and window B (background) is the area
off the pinhole slice pattern areas on the detector.
This kind of monitoring was introduced 2010-01-28.
IFS_DARK master frames are not used to calibrate science observations, only
the ancillary IFS_DARK product IFS_STATIC_BADPIXEL is used. IFS_BACK
calibrations are used to calibrate science observations.
General information
Click on any of the plots to see a close-up version.
The latest date is indicated on top of the plot.
If configured,
- data points belonging to the latest date are specially marked
- statistical averages are indicated by a solid line, and thresholds by broken lines
- outliers are marked by a red asterisk. They are defined as data points outside the
threshold lines
- "aliens" (= data points outside the plot Y limits) are marked by a red arrow (↑ or ↓)
- you can download the data for each parameter set if the 'Data downloads' link shows up
|
