Plot
? |
Symb
? |
Source
* |
Average ? |
Thresholds ? |
N_
data |
QC1
parameter |
Data
downloads |
Remarks |
| method |
value |
unit |
method |
value |
| 1 |
• | QC1DB |
MEDIAN |
-0.365 |
ADU/pix/hr |
VAL | -1.35,0.69 |
15 |
current_dark |
this |
last_yr |
all
|
dark current, readout mode 225kHz,1x1,low; BLUE CCD |
| 2 |
• | QC1DB |
MEDIAN |
0.58 |
ADU/pix/hr |
VAL | -0.382,1.394 |
15 |
current_dark |
this |
last_yr |
all
|
same for REDU CCD |
| 3 |
• | QC1DB |
MEDIAN |
-0.084 |
|
VAL | -1.179,1.179 |
15 |
current_dark |
this |
last_yr |
all
|
same for REDL CCD |
| 4 |
• | QC1DB |
MEDIAN |
-1.06 |
ADU/pix/hr |
VAL | -2.889,1.083 |
18 |
current_dark |
this |
last_yr |
all
|
dark current, readout mode 50kHz,2x2,high; BLUE CCD |
| 5 |
• | QC1DB |
MEDIAN |
3.08 |
ADU/pix/hr |
VAL | 1.073,4.667 |
16 |
current_dark |
this |
last_yr |
all
|
same for REDU CCD |
| 6 |
• | QC1DB |
MEDIAN |
1.41 |
ADU/pix/hr |
VAL | -2.221,3.755 |
16 |
current_dark |
this |
last_yr |
all
|
same for REDL CCD |
| |
|
*Data sources: QC1DB: QC1 database; LOCAL: local data source
|
Plot 1
scores:  3| 3|
| | data source: | uves_dark
(QC1 database) |
| dataset: | current_dark | • |
| median: | -0.365 | ADU/pix/hr |
| fixed thresholds: | -1.35...0.69 | ADU/pix/hr |
| N_data plotted: | 15 |
| [click plot for closeup] |
Plot 2
scores: 3|
| | data source: | uves_dark
(QC1 database) |
| dataset: | current_dark | • |
| median: | 0.58 | ADU/pix/hr |
| fixed thresholds: | -0.382...1.394 | ADU/pix/hr |
| N_data plotted: | 15 |
| [click plot for closeup] |
Plot 3
scores: 3|
| | data source: | uves_dark
(QC1 database) |
| dataset: | current_dark | • |
| median: | -0.084 | |
| fixed thresholds: | -1.179...1.179 | |
| N_data plotted: | 15 |
| [click plot for closeup] |
Plot 4
scores: 9|
| | data source: | uves_dark
(QC1 database) |
| dataset: | current_dark | • |
| median: | -1.06 | ADU/pix/hr |
| fixed thresholds: | -2.889...1.083 | ADU/pix/hr |
| N_data plotted: | 18 |
| [click plot for closeup] |
Plot 5
scores: 7|
| | data source: | uves_dark
(QC1 database) |
| dataset: | current_dark | • |
| median: | 3.08 | ADU/pix/hr |
| fixed thresholds: | 1.073...4.667 | ADU/pix/hr |
| N_data plotted: | 16 |
| [click plot for closeup] |
Plot 6
scores: 7|
| | data source: | uves_dark
(QC1 database) |
| dataset: | current_dark | • |
| median: | 1.41 | ADU/pix/hr |
| fixed thresholds: | -2.221...3.755 | ADU/pix/hr |
| N_data plotted: | 16 |
| [click plot for closeup] |
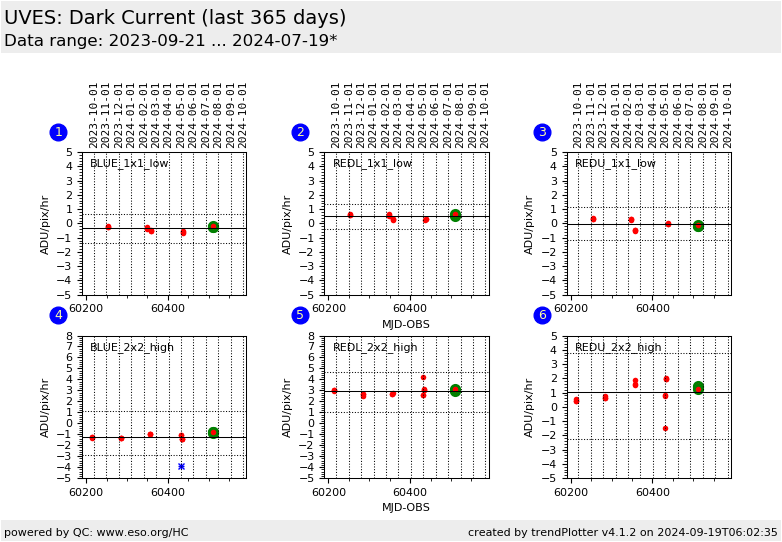
This is the trending report for UVES QC parameters derived from DARK frames.
These frames are taken approximately once per month, as a set of 3
consecutive exposures of 3600 secs each. These data are de-biased and
combined into a MASTER_DARK, in which the average dark level is
measured (in ADU/px/hr).
These plots describe:
- the DARK current in master DARK frames of the BLUE chip in the 1x1 binning, 225kHz, low gain readout mode
- same for REDL chip, 1x1
- same for REDU chip, 1x1
- the DARK current in master DARK frames of the BLUE chip in the 2x2 binning, 50kHz, high gain readout mode
- same for REDL chip, 2x2
- same for REDU chip, 2x2
From user manuals in e-/pix/h (ADU/pix/h) at -120C:
- BLUE Chip: 0.4 (lg: 0.22, hg: 0.74)
- RED CHIPL: 0.5 (lg: 0.31, hg: 0.96)
- RED CHIPU: 1.5 (lg: 1.03, hg: 2.88)
Thresholds and reference values are set using the KPI document
- BLUE_1x1_225 VAL=-1.35,0.69 REF=-0.33
- REDL_1x1_225 VAL=-0.382,1.394 REF=0.506
- REDU_1x1_225 VAL=-1.179,1.179 REF=0
- BLUE_2x2_50 VAL=-2.889,1.083 REF=-0.903
- REDL_2x2_50 VAL=1.073,4.667 REF=2.87
- REDU_2x2_50 VAL=-2.221,3.755 REF=0.767
Find more information about UVES DARK frames here.
You can see here
basic QC parameters related to detector properties (like median level,
ReadOut Noise, etc).
General information
Click on any of the plots to see a close-up version.
The latest date is indicated on top of the plot.
If configured,
- data points belonging to the latest date are specially marked
- statistical averages are indicated by a solid line, and thresholds by broken lines
- outliers are marked by a red asterisk. They are defined as data points outside the
threshold lines
- "aliens" (= data points outside the plot Y limits) are marked by a red arrow (↑ or ↓)
- you can download the data for each parameter set if the 'Data downloads' link shows up
|
