Plot
? |
Symb
? |
Source
* |
Average ? |
Thresholds ? |
N_
data |
QC1
parameter |
Data
downloads |
Remarks |
| method |
value |
unit |
method |
value |
| 1 |
• | QC1DB |
MEDIAN |
45.6 |
ADU |
none | |
47 |
duty_cycle |
this |
last_yr |
all
|
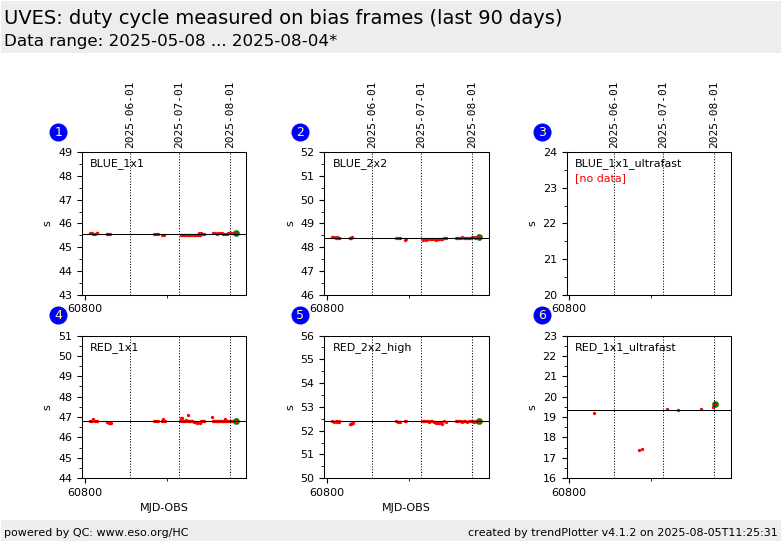
duty cycle in BIAS, readout mode 225kHz,1x1,low; BLUE CCD |
| 2 |
• | QC1DB |
MEDIAN |
48.4 |
ADU |
none | |
45 |
duty_cycle |
this |
last_yr |
all
|
duty cycle in BIAS, readout mode 50kHz,2x2,high; BLUE CCD |
| 3 |
• | QC1DB |
MEDIAN |
|
ADU |
none | |
0 |
duty_cycle |
this |
last_yr |
all
|
duty cycle in BIAS, readout mode 625kHz (ultrafast),1x1,low; BLUE CCD |
| 4 |
• | QC1DB |
MEDIAN |
46.8 |
ADU |
none | |
67 |
duty_cycle |
this |
last_yr |
all
|
duty cycle in BIAS, readout mode 225kHz,1x1,low; RED CCD |
| 5 |
• | QC1DB |
MEDIAN |
52.4 |
ADU |
none | |
45 |
duty_cycle |
this |
last_yr |
all
|
duty cycle in BIAS, readout mode 50kHz,2x2,high; RED CCD |
| 6 |
• | QC1DB |
MEDIAN |
19.4 |
ADU |
none | |
8 |
duty_cycle |
this |
last_yr |
all
|
duty cycle in BIAS, readout mode 625kHz (ultrafast),1x1,low; RED CCD |
| |
|
*Data sources: QC1DB: QC1 database; LOCAL: local data source
|
Plot 1
scores: not implemented
| | data source: | uves_bias
(QC1 database) |
| dataset: | duty_cycle | • |
| median: | 45.6 | ADU |
| thresholds: | none | |
| N_data plotted: | 47 |
| [click plot for closeup] |
Plot 2
scores: not implemented
| | data source: | uves_bias
(QC1 database) |
| dataset: | duty_cycle | • |
| median: | 48.4 | ADU |
| thresholds: | none | |
| N_data plotted: | 45 |
| [click plot for closeup] |
Plot 3
scores: not implemented
| | data source: | uves_bias
(QC1 database) |
| dataset: | duty_cycle | • |
| median: | no data | ADU |
| thresholds: | none | |
| N_data plotted: | 0 |
| [click plot for closeup] |
Plot 4
scores: not implemented
| | data source: | uves_bias
(QC1 database) |
| dataset: | duty_cycle | • |
| median: | 46.8 | ADU |
| thresholds: | none | |
| N_data plotted: | 67 |
| [click plot for closeup] |
Plot 5
scores: not implemented
| | data source: | uves_bias
(QC1 database) |
| dataset: | duty_cycle | • |
| median: | 52.4 | ADU |
| thresholds: | none | |
| N_data plotted: | 45 |
| [click plot for closeup] |
Plot 6
scores: not implemented
| | data source: | uves_bias
(QC1 database) |
| dataset: | duty_cycle | • |
| median: | 19.4 | ADU |
| thresholds: | none | |
| N_data plotted: | 8 |
| [click plot for closeup] |
This is a trending report for the duty cycle calculated on the UVES BIAS frames.
We monitor here the time to store a UVES frame for the different setups which
has to be taken into account when calculating overheads.
From user manual in s:
- BLUE Chip 2x2/1pt/50kHz: 48
- BLUE Chip 1pt/225kHz: 46
- BLUE Chip 2pts/625kHz: 22
- RED Chip 2x2/2pts/50kHz: 52
- RED Chip 2pts/225kHz: 47
- RED Chip 4pts/625kHz: 19
General information
Click on any of the plots to see a close-up version.
The latest date is indicated on top of the plot.
If configured,
- data points belonging to the latest date are specially marked
- statistical averages are indicated by a solid line, and thresholds by broken lines
- outliers are marked by a red asterisk. They are defined as data points outside the
threshold lines
- "aliens" (= data points outside the plot Y limits) are marked by a red arrow (↑ or ↓)
- you can download the data for each parameter set if the 'Data downloads' link shows up
|
