Plot
? |
Symb
? |
Source
* |
Average ? |
Thresholds ? |
N_
data |
QC1
parameter |
Data
downloads |
Remarks |
| method |
value |
unit |
method |
value |
| 1 |
• | QC1DB |
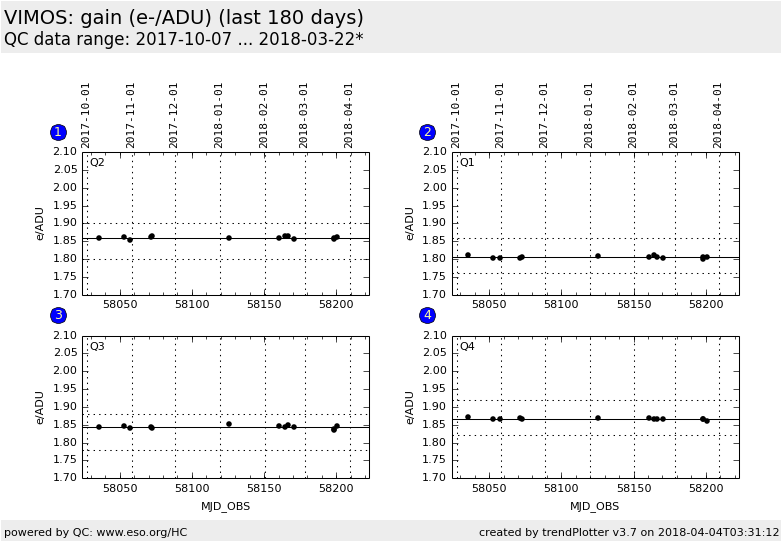
MEDIAN |
1.86 |
e/ADU |
VAL | 1.80,1.9 |
13 |
conad_avg |
this |
last_yr |
all
|
gain for 225kHz,1port,Low read-out mode |
| 2 |
• | QC1DB |
MEDIAN |
1.8 |
e/ADU |
VAL | 1.76,1.86 |
13 |
conad_avg |
this |
last_yr |
all
|
gain for 225kHz,1port,Low read-out mode |
| 3 |
• | QC1DB |
MEDIAN |
1.84 |
e/ADU |
VAL | 1.78,1.88 |
13 |
conad_avg |
this |
last_yr |
all
|
gain for 225kHz,1port,Low read-out mode |
| 4 |
• | QC1DB |
MEDIAN |
1.87 |
e/ADU |
VAL | 1.82,1.92 |
13 |
conad_avg |
this |
last_yr |
all
|
gain for 225kHz,1port,Low read-out mode |
| |
|
*Data sources: QC1DB: QC1 database; LOCAL: local data source
|
Plot 1
scores:  3| 3|
| | data source: | vimos_scrflat
(QC1 database) |
| dataset: | conad_avg | • |
| median: | 1.86 | e/ADU |
| fixed thresholds: | 1.8...1.9 | e/ADU |
| N_data plotted: | 13 |
| [click plot for closeup] |
Plot 2
scores: 3|
| | data source: | vimos_scrflat
(QC1 database) |
| dataset: | conad_avg | • |
| median: | 1.8 | e/ADU |
| fixed thresholds: | 1.76...1.86 | e/ADU |
| N_data plotted: | 13 |
| [click plot for closeup] |
Plot 3
scores: 3|
| | data source: | vimos_scrflat
(QC1 database) |
| dataset: | conad_avg | • |
| median: | 1.84 | e/ADU |
| fixed thresholds: | 1.78...1.88 | e/ADU |
| N_data plotted: | 13 |
| [click plot for closeup] |
Plot 4
scores: 3|
| | data source: | vimos_scrflat
(QC1 database) |
| dataset: | conad_avg | • |
| median: | 1.87 | e/ADU |
| fixed thresholds: | 1.82...1.92 | e/ADU |
| N_data plotted: | 13 |
| [click plot for closeup] |
Trending plot for GAIN (conversion factor from ADU to electrons, e-/ADU).
The gain is determined from imaging lamp flats taken with the R filter and with the 225kHz,1port,Low
read-out mode. Please note that in the VIMOS headers this quantity is written as CONAD.
Template ID: img_cal_ScreenFlat. Pipeline recipe: vmimflatscreen.
General information
Click on any of the plots to see a close-up version.
The latest date is indicated on top of the plot.
If configured,
- data points belonging to the latest date are specially marked
- statistical averages are indicated by a solid line, and thresholds by broken lines
- outliers are marked by a red asterisk. They are defined as data points outside the
threshold lines
- "aliens" (= data points outside the plot Y limits) are marked by a red arrow (↑ or ↓)
- you can download the data for each parameter set if the 'Data downloads' link shows up
|
