problems
| HOME | INDEX | SEARCH | HELP | NEWS |
| VIRCAM: problems |
|||||
|
|
This page describes instrument related particularities, unwanted features and problems.
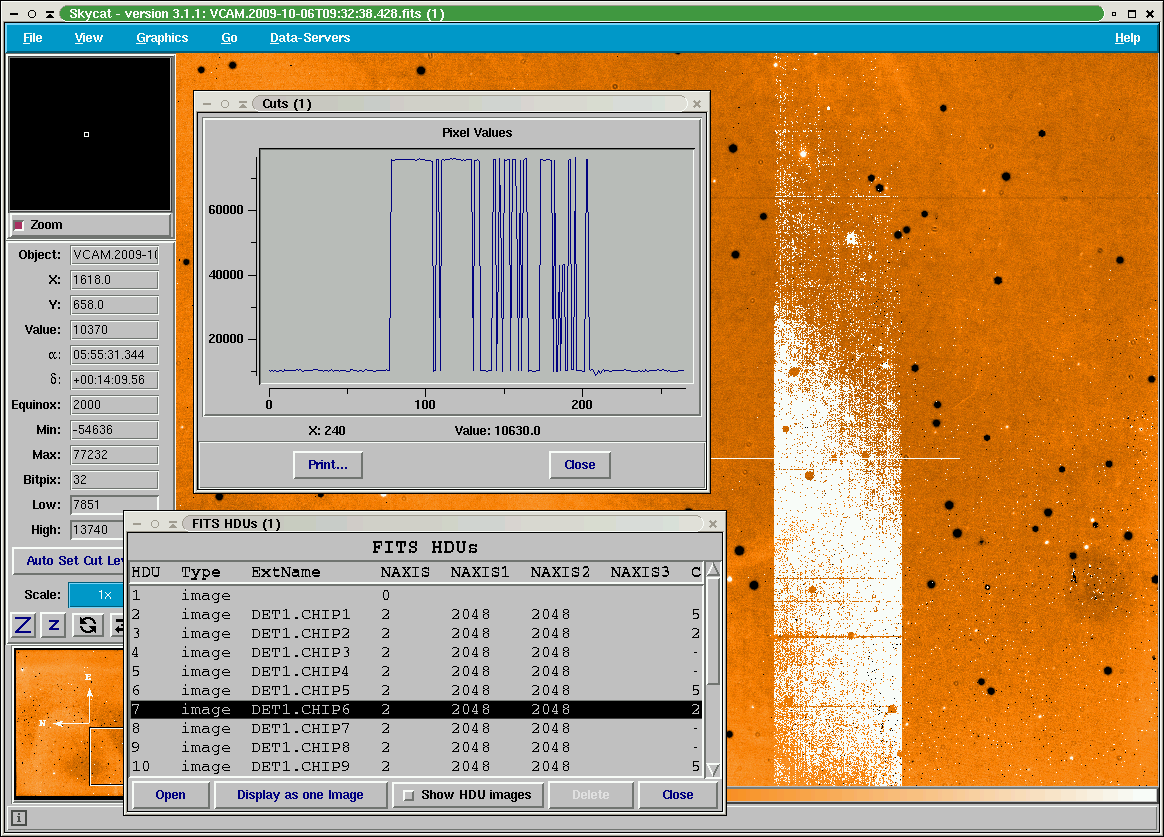
Chip #6 shows in channel #14 sporadic large area saturation events. The effect was never seen in DARK or RESET frames. It becomes apparent in all 5 jitter frames of a standard star calibrations and in science frames. It can shows up also in twilight flat calibrations (e.g. the last three raw frames of the H-band twilight flat stack taken on 2009-11-23). No masking is provided within the calibration recipes of the data reduction pipeline operated at Paranal and at ESO HQ. Impact:
The effect is monitored: For each first raw frame of a standard star stack the median flux of part of channel #14 region is measured and ingested into the QC1 database as qc_counts_C14. The same QC measure is applied to science paw prints, in case they are processed by QC in Garching.
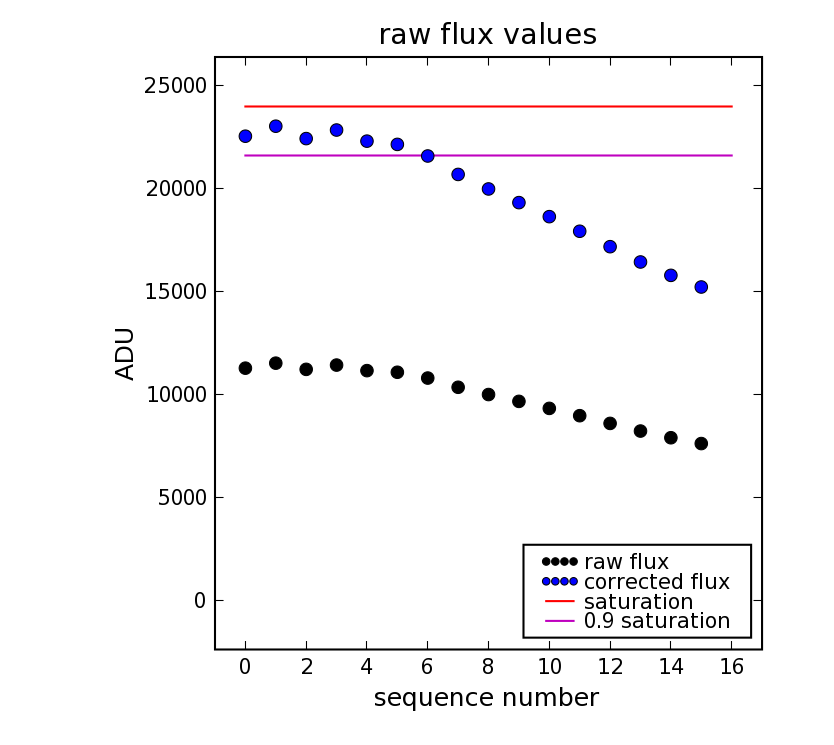
The acquisition of photons by near infrared detectors consists of an initial reset, a first non-destructive read out followed by one or more further reads. The signal recorded between the reset and the first read is subtracted by the acquisition system before being written to file. The time between the reset and the first read amounts to 1.0011 sec and is called the minimum possible DIT (= MINDIT). The time between the first and the final read is called DIT. The fits frame contains the counts accumulated within DIT seconds, but the pixels on the detector hosted more counts accumulated within DIT + MINDIT seconds and might saturate the chip. This internal saturation can occur for high fluxes and when a DIT of the order of MINDIT is used. This effect occurred for a number of raw twilight flats in some periods during the commissioning (2008-10-01 - 2009-10-25), science verification (2009-10-15 - 2009-11-03) and dry runs (2009-11-04 - 2010-02-15). Assuming linear response the signal on the detector before reset subtraction can be estimated : counts[detector] = counts[rawframe] * ( MINDIT + DIT ) / DIT The counts[detector] values are monitored for twilight flats. The maximum values within a raw frame stack is given in units of the individual detector saturation level by the dimensionless QC1 parameter qc_twflat_fracsat. The values are scored.
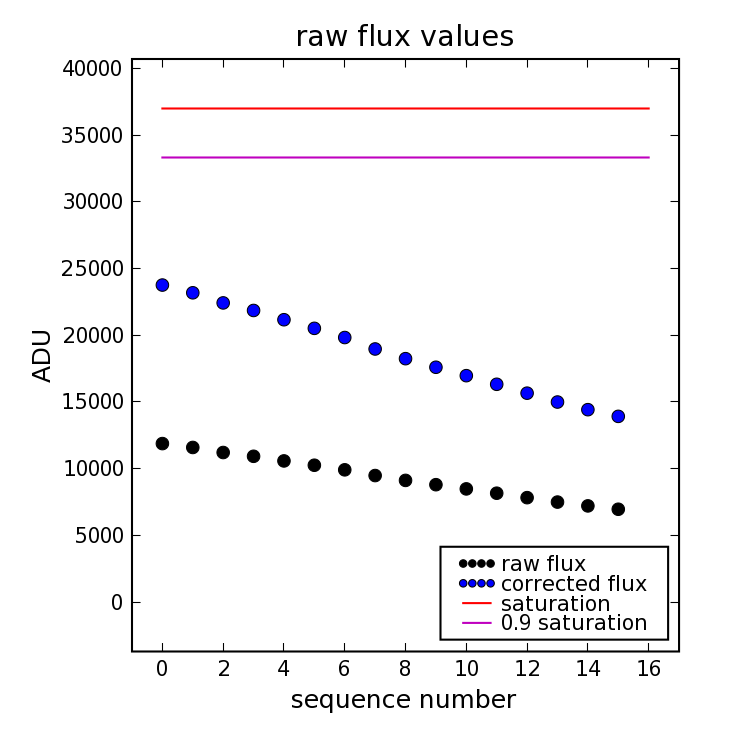
Left figure: fluxes of a stack of twilight flat raw frames with DIT=1.0011 sec for detector #5. The black dots dow the counts[rawframe] values and are well be low the saturation level. The blue dots show the counts[detector] values of which the first frames show saturation effects. The saturation level and the scoring threshold (= 90% of saturation level) are shown. Right figure: The same stack for detector #11 with a higher saturation level. The upper part of detector #16 shows the following effect when being illuminated:
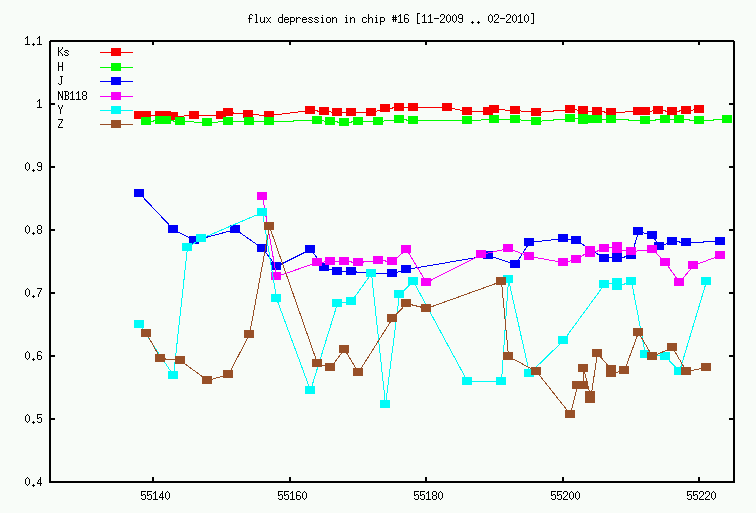
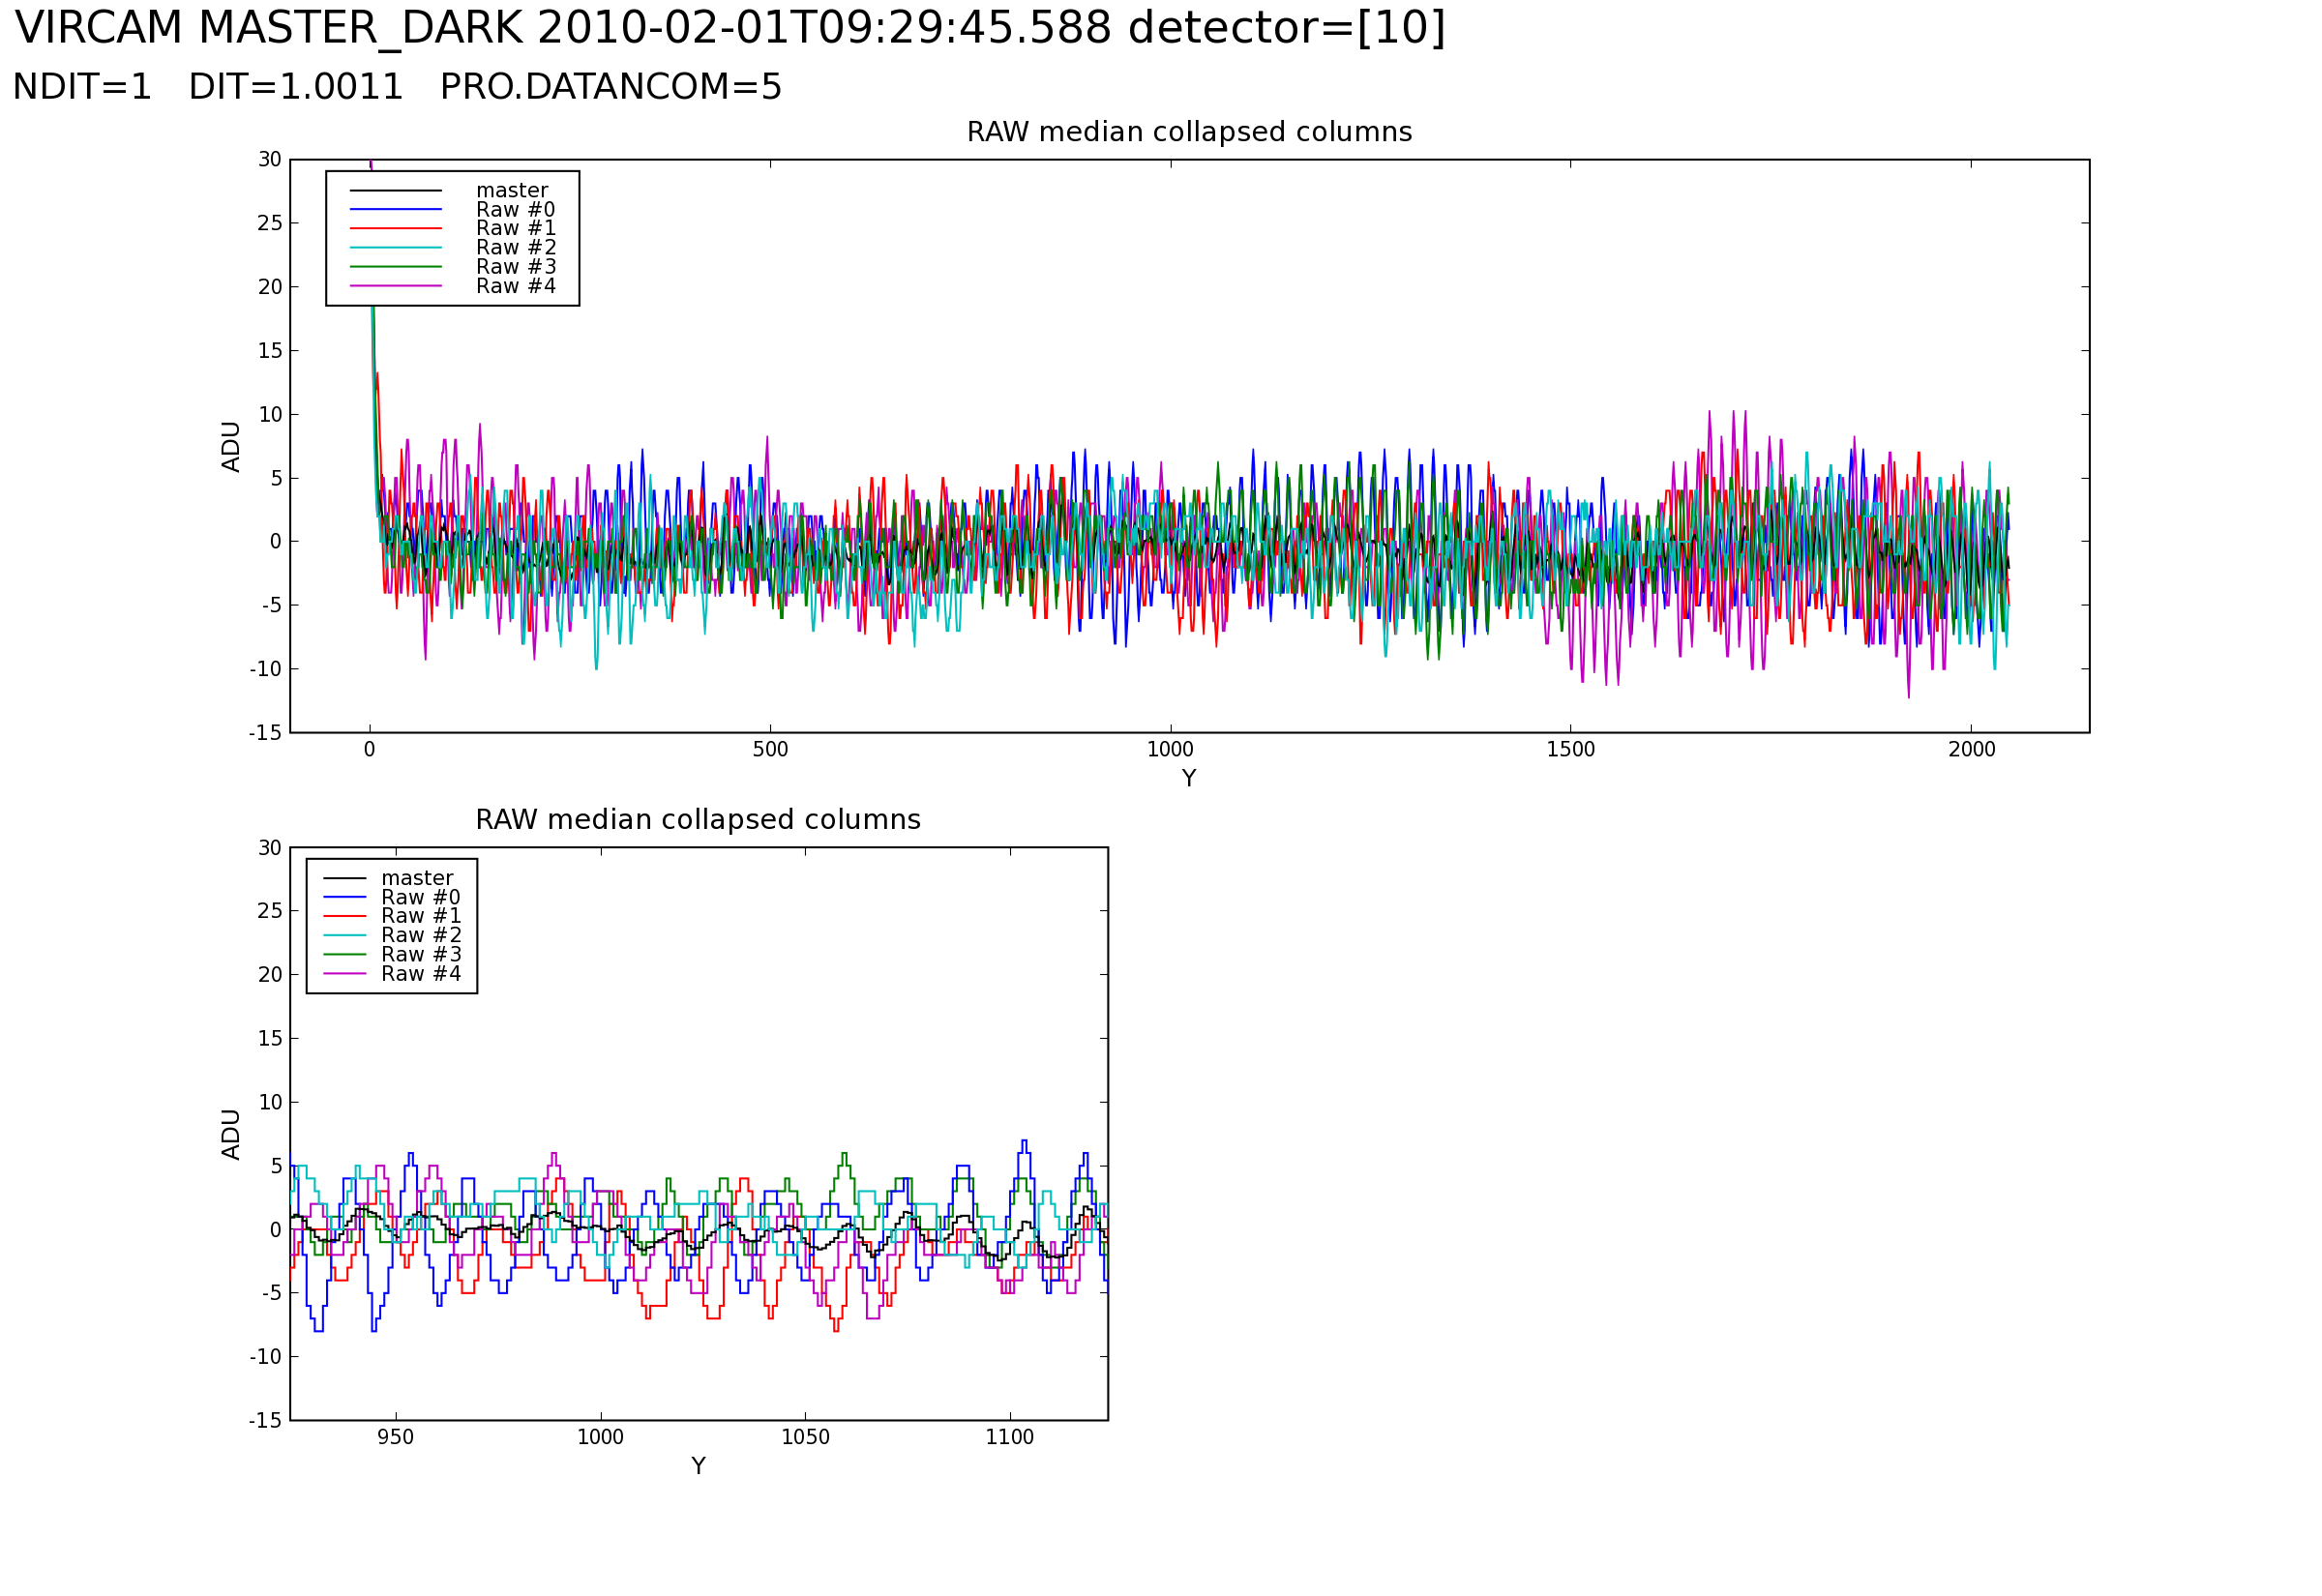
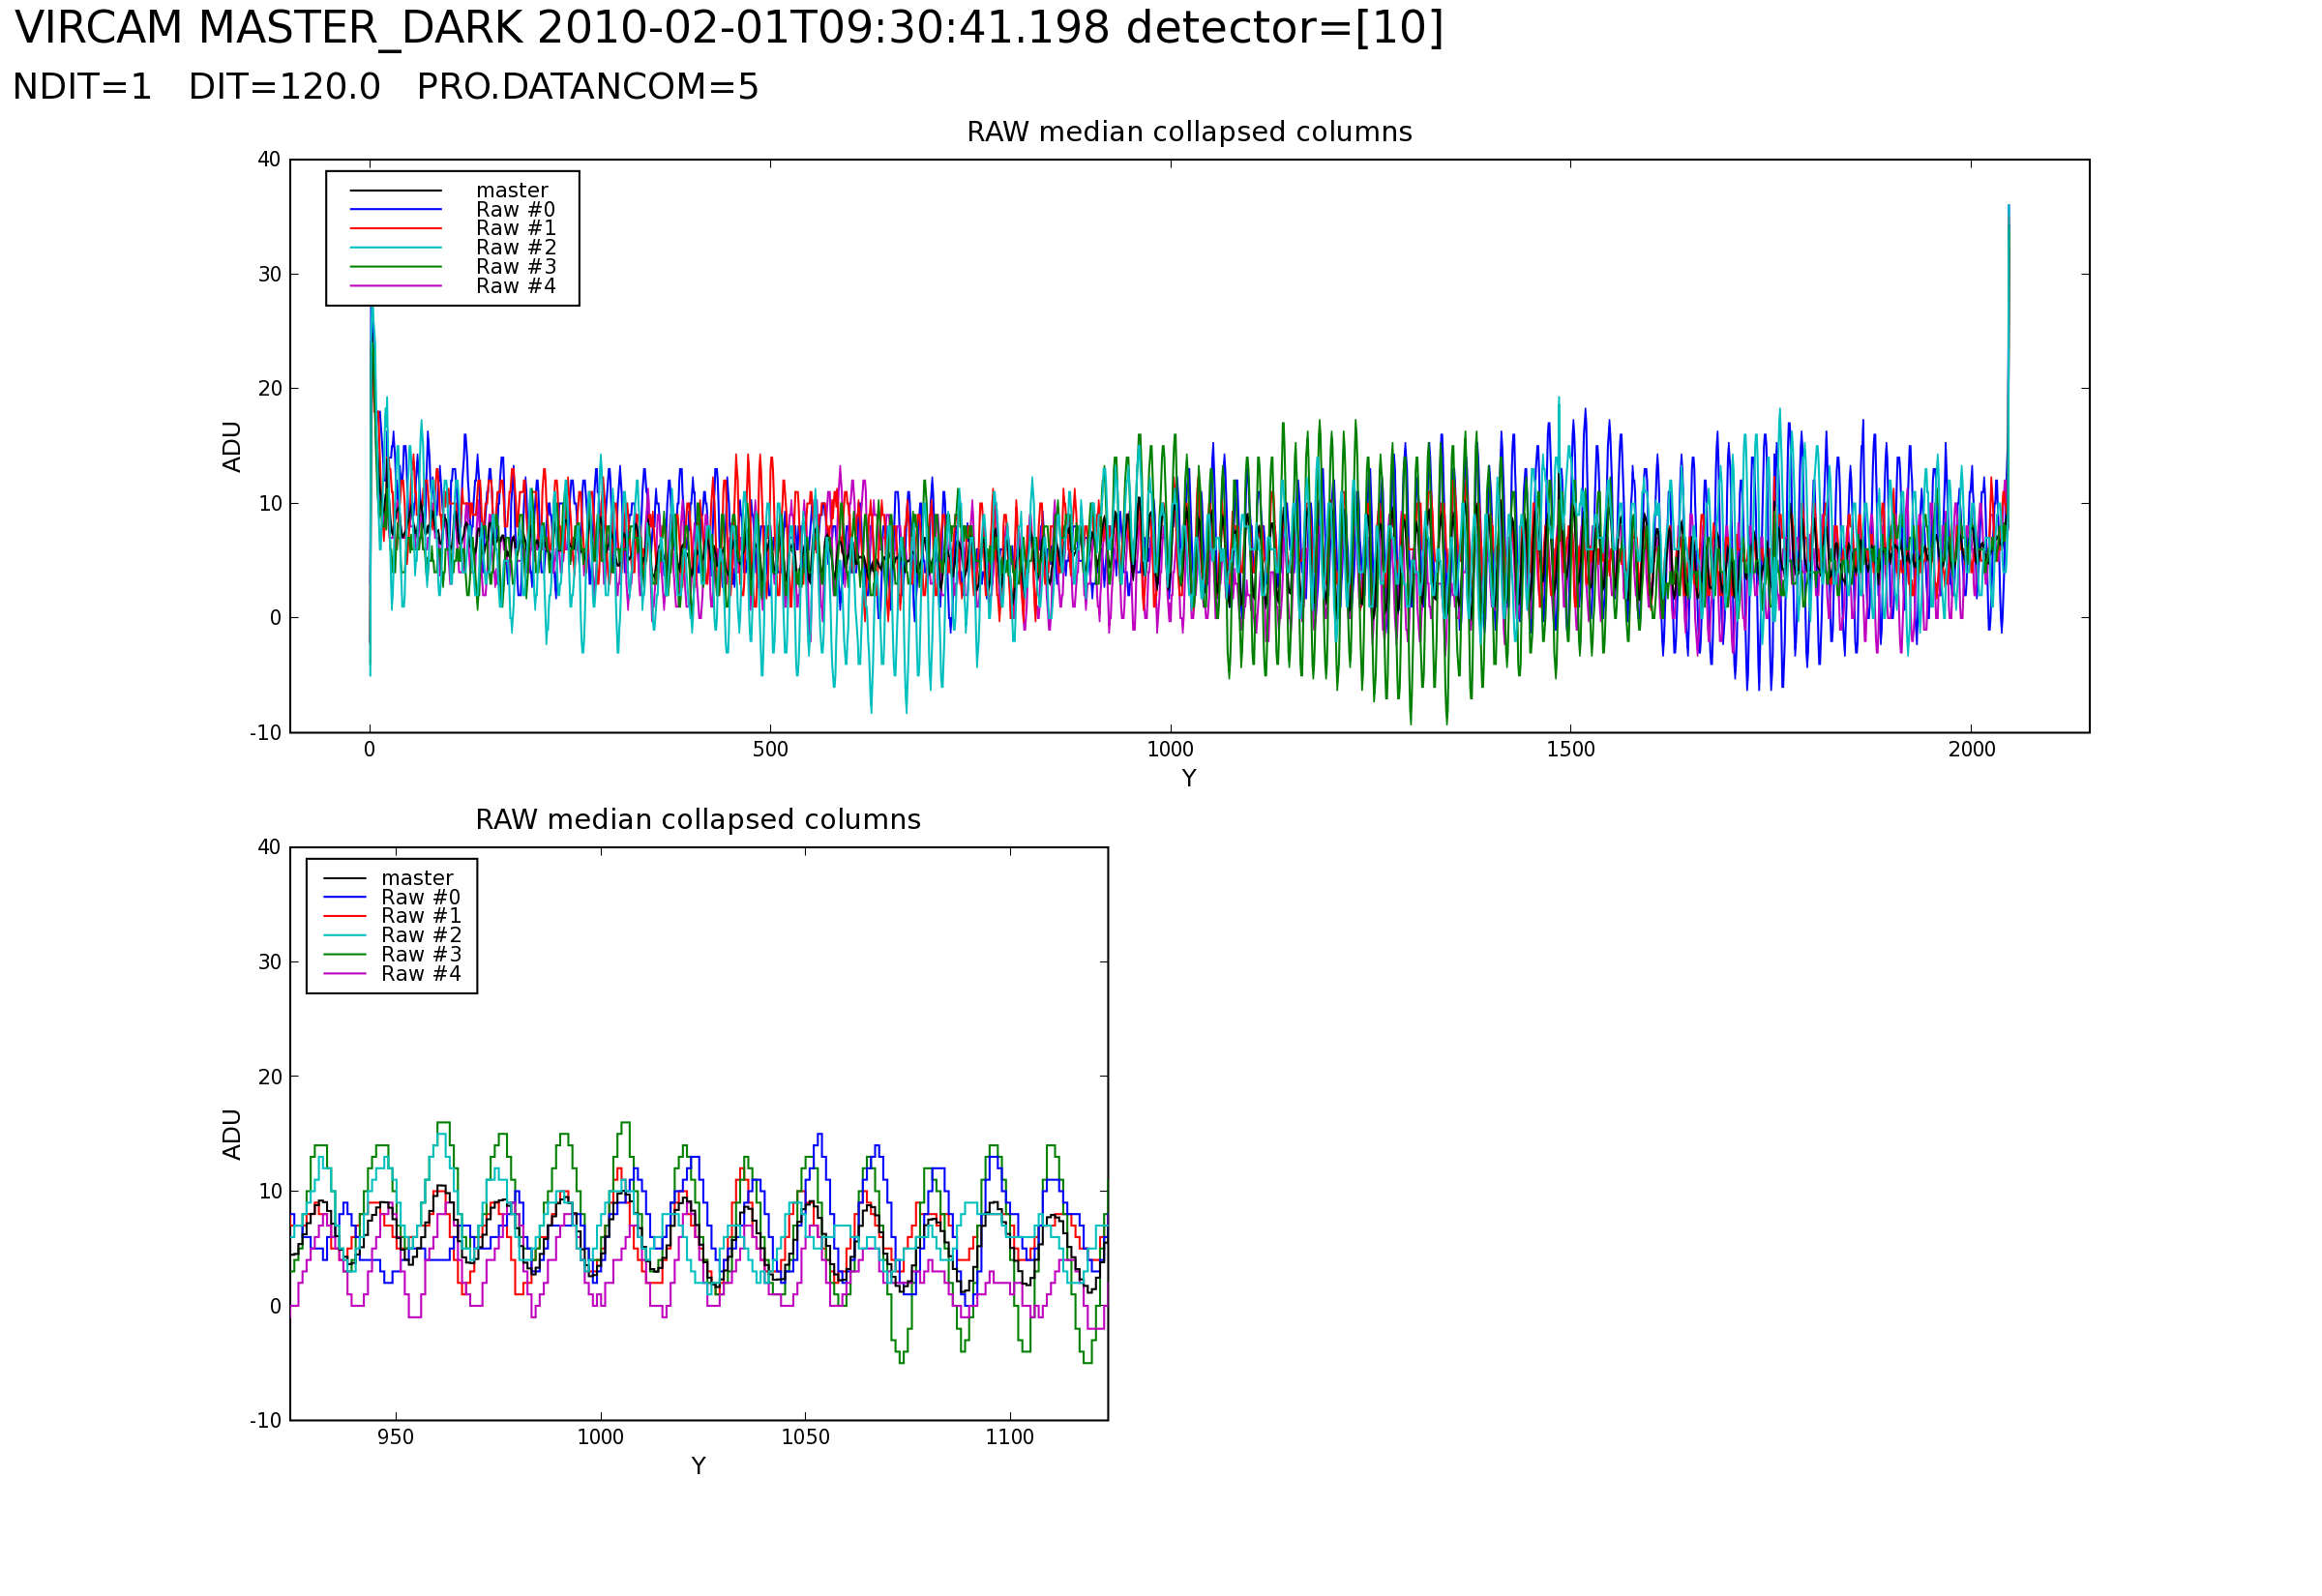
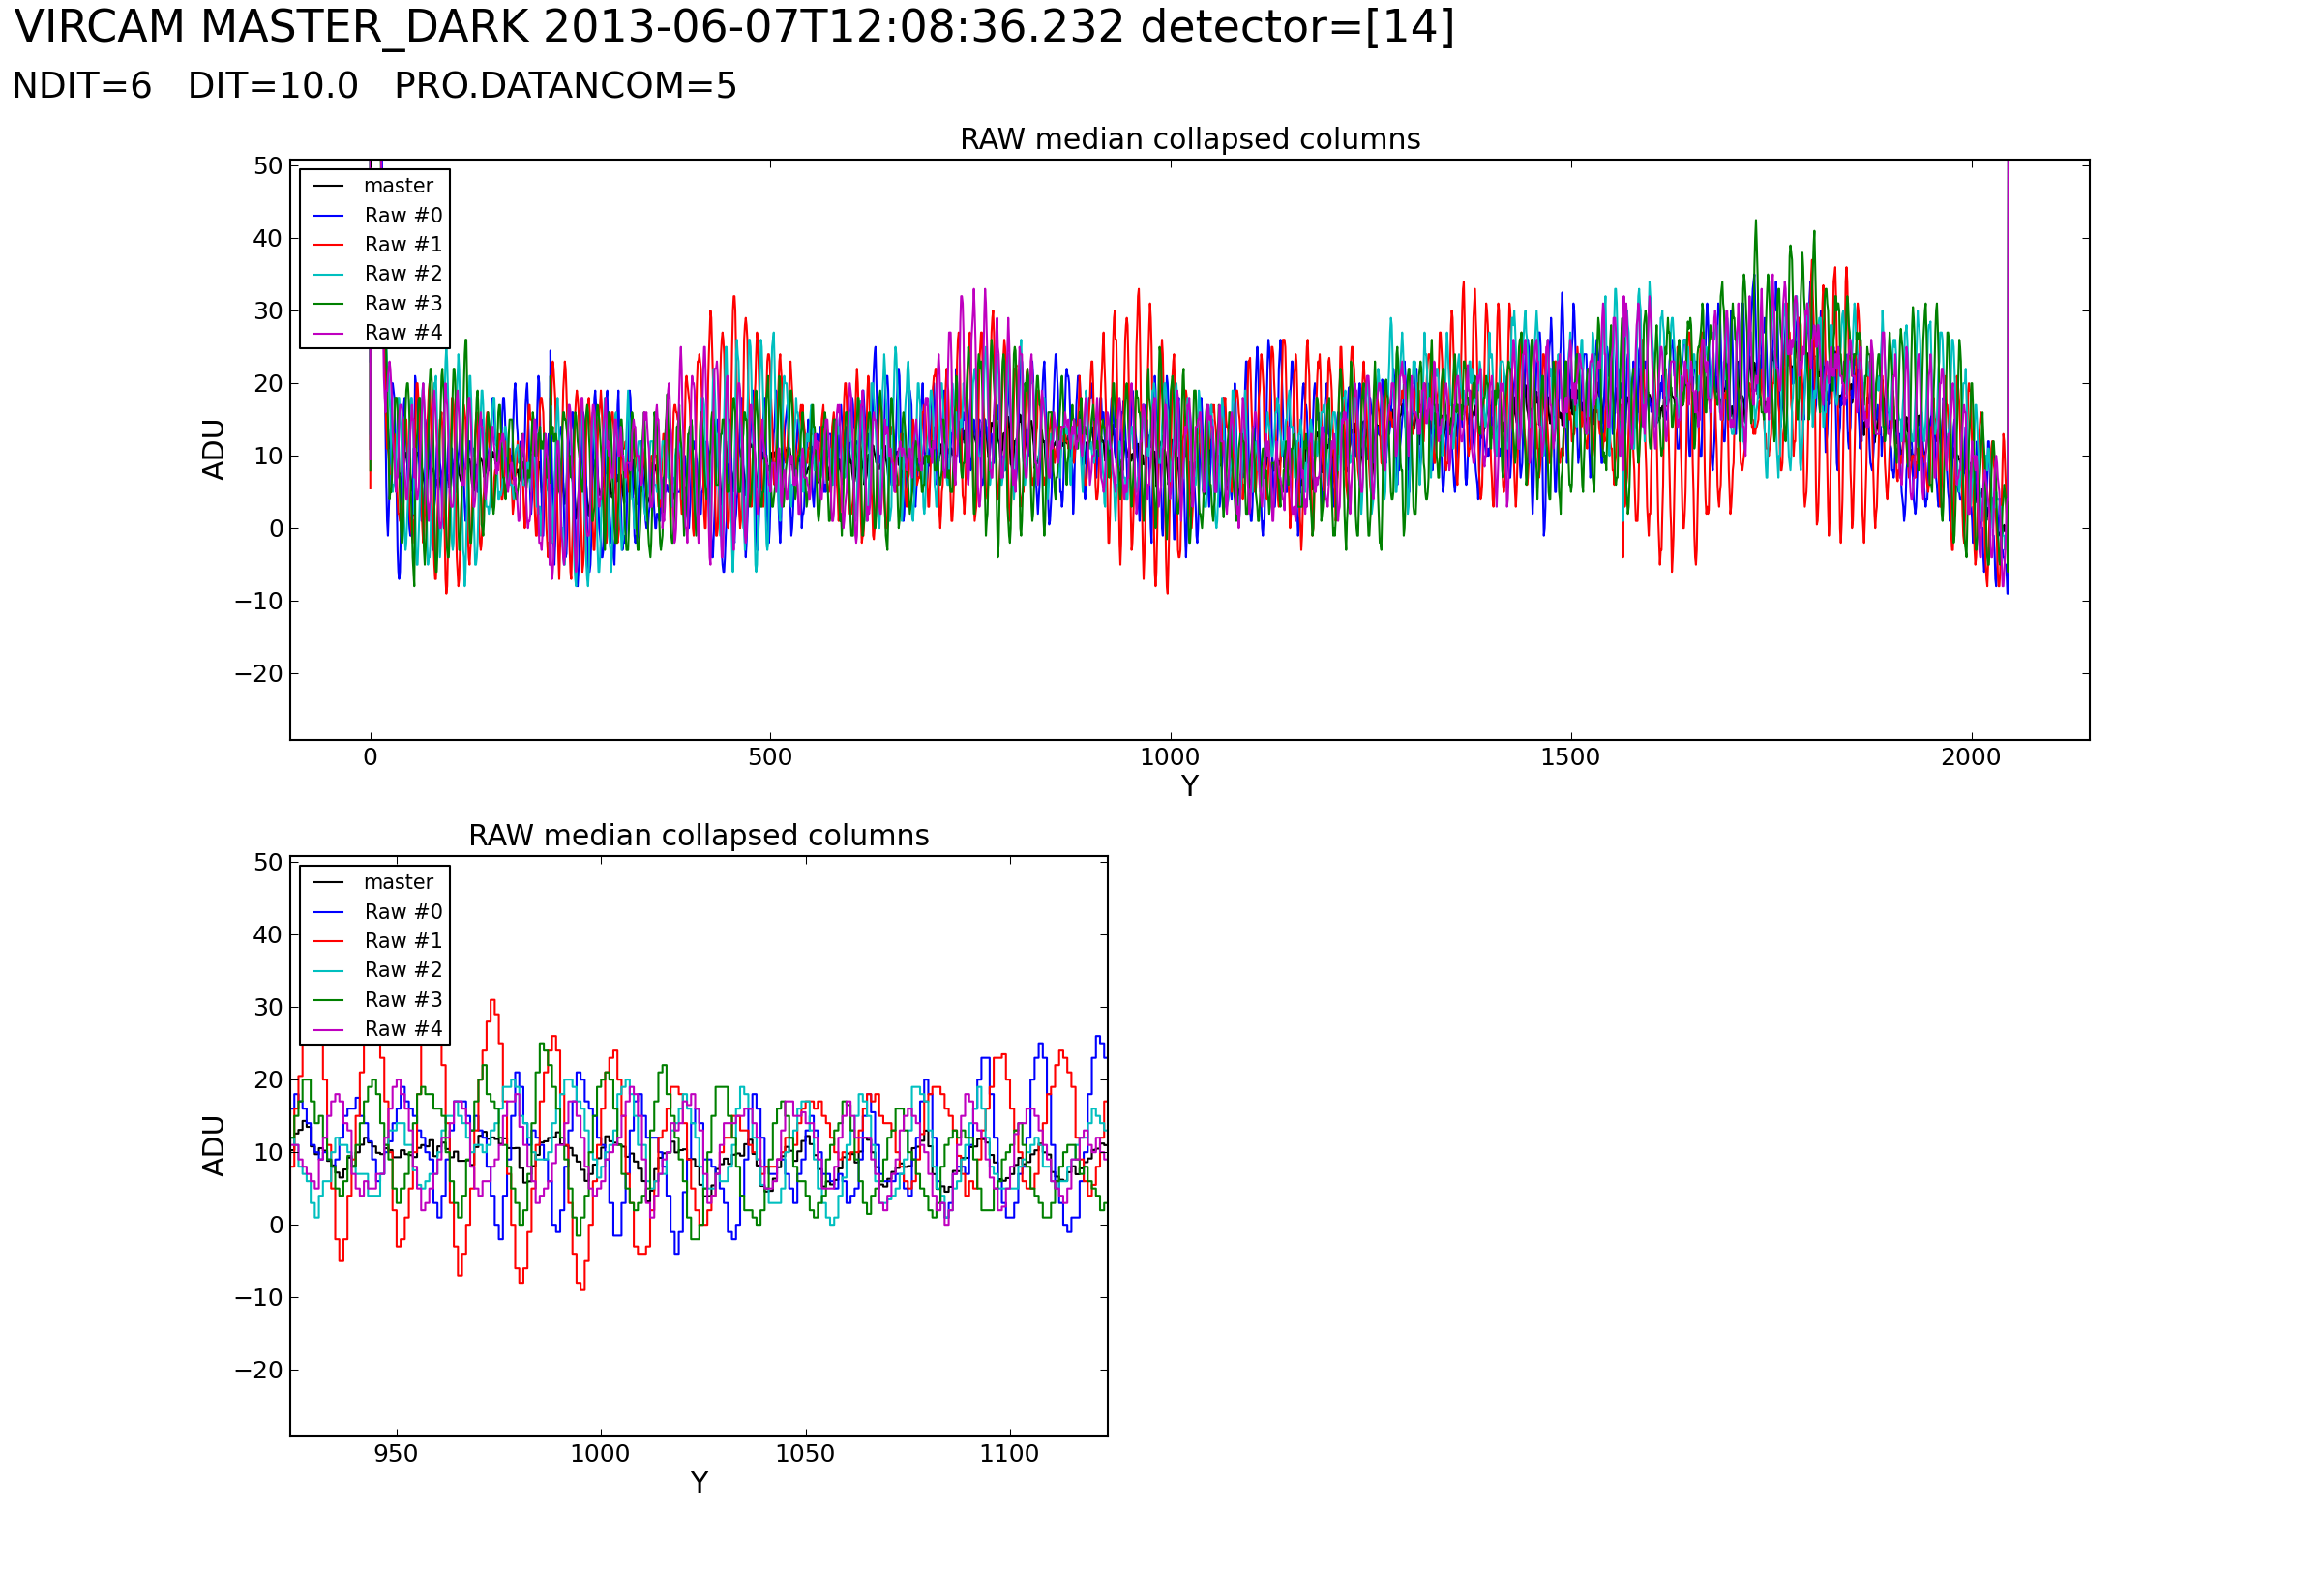
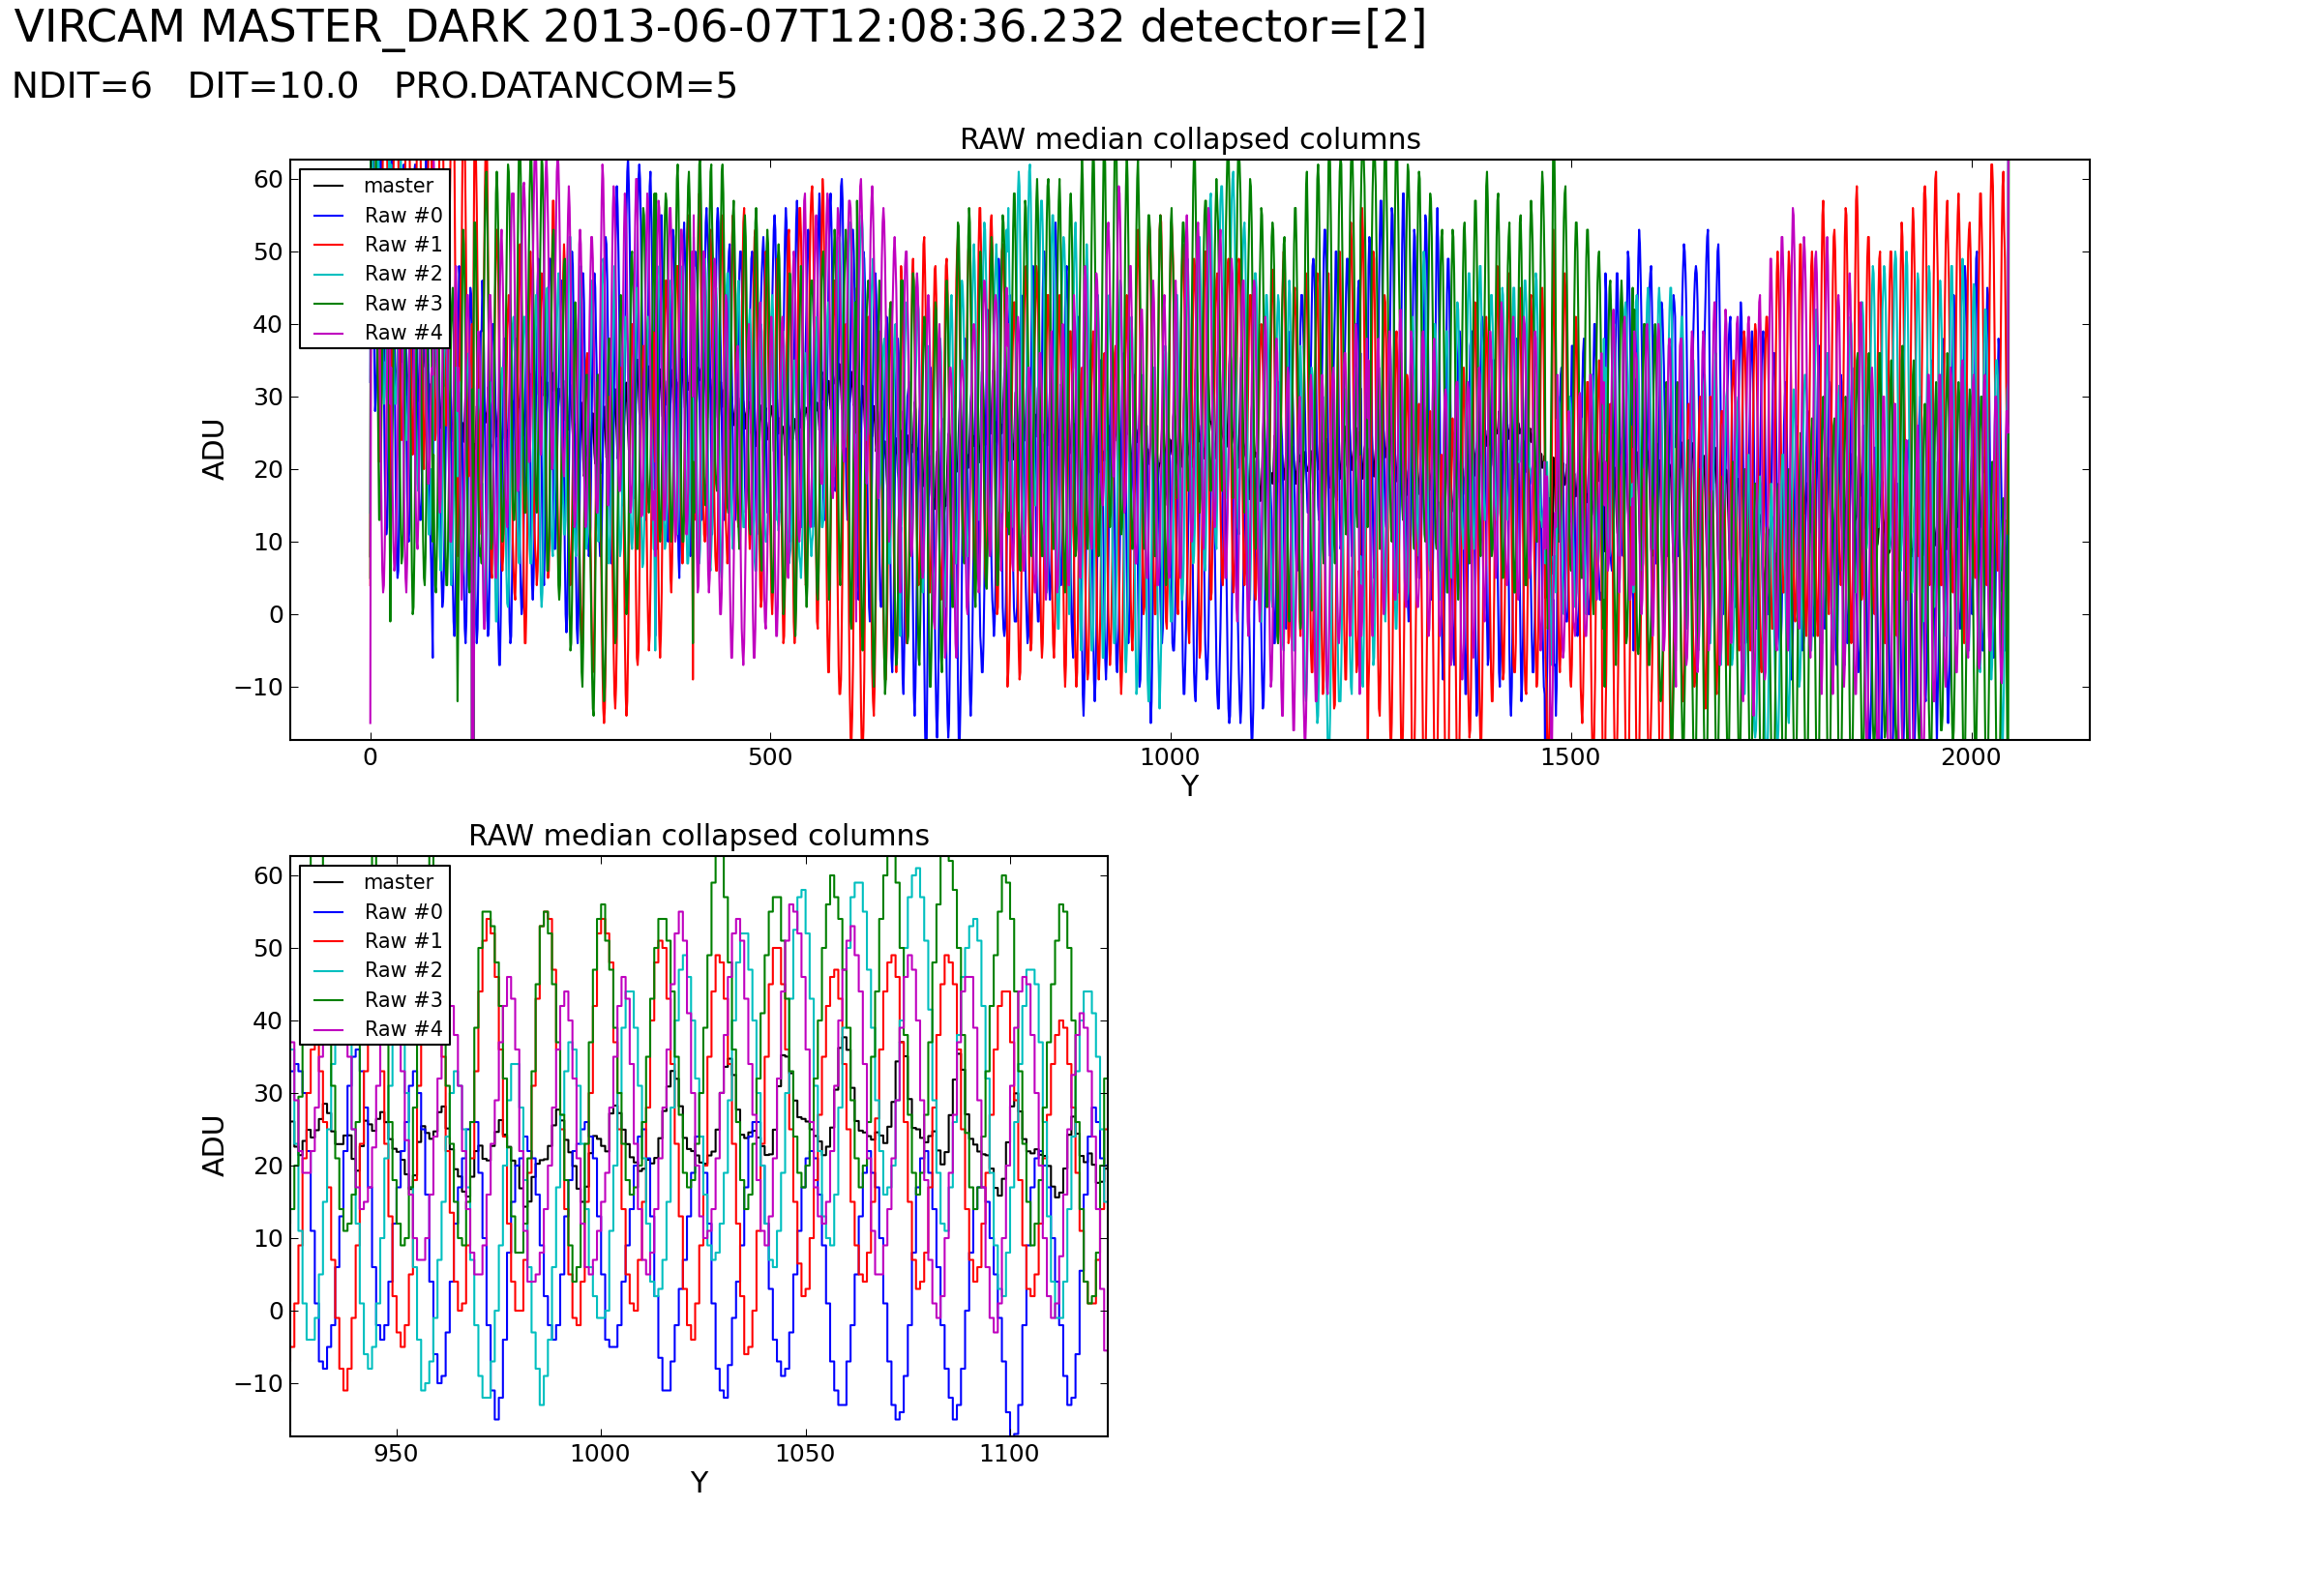
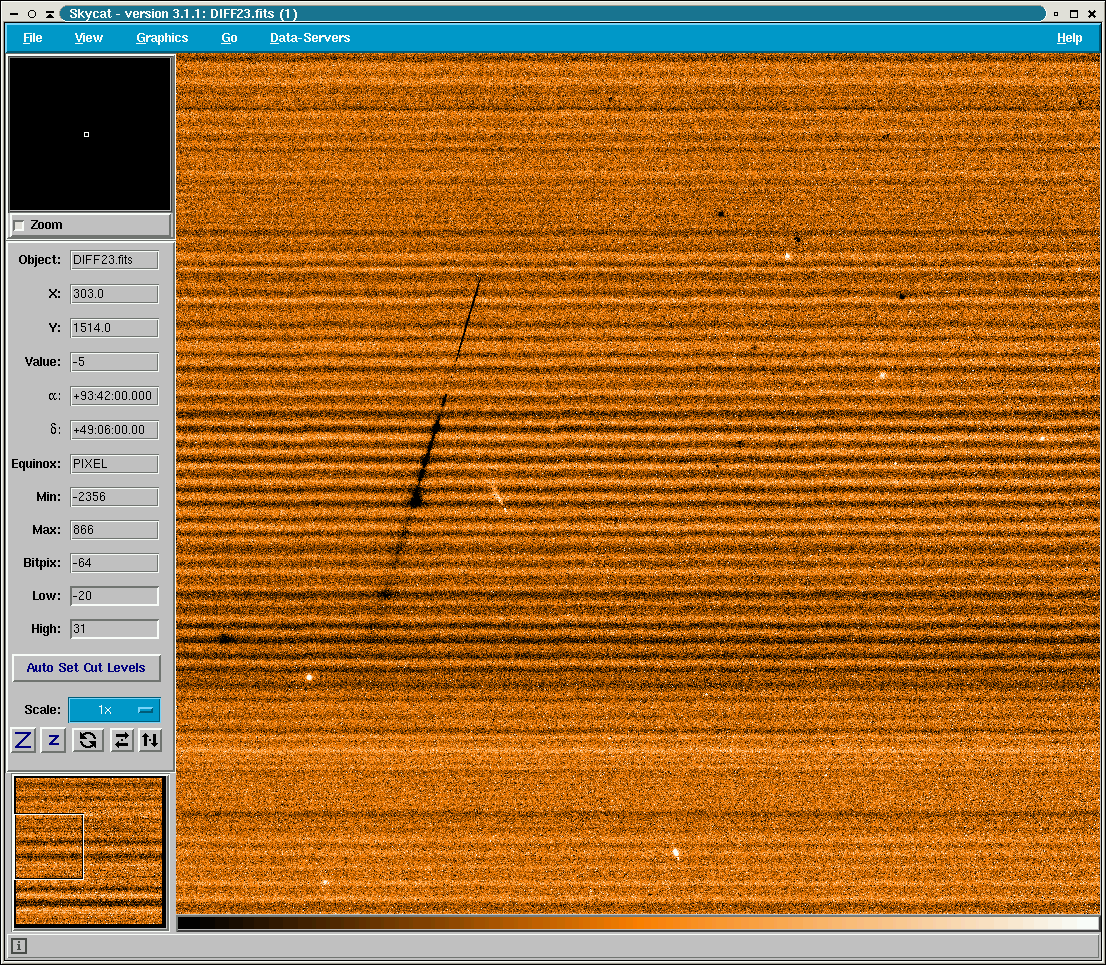
Figure: The QC1 parameter qc_twflat_fluxdep, as obtained from detector #16 master twilight flats. The parameter represents the median flux in the upper part of the detector in the pixel area: 1500,2048: 2048,2048. The abscissa is the MJD-OBS (modified Julian Date). The behavior of chip #16 is monitored in a dedicated trending plot. All VIRCAM raw frames show horizontal stripes for all DITs, most apparent in dark calibrations. The stripe pattern is conserved for each group of four detectors in a row, meaning detectors #1, #2, #3 and #4 show the same stripe pattern, detectors #5, #6, #7 and #8 show a distinct pattern but among themselves the same. Detectors #9, #10, #11 and #12 build another group of detectors with the same stripe pattern; detectors #13, #14, #15 and #16 as well. The pattern is changing from readout to readout and it is not reproducible. The frequency of the pattern, the amplitude and the offset is variable. The master dark pipeline products shows the interference of five raw input frame signals.
Horizontal stripes have the following implications
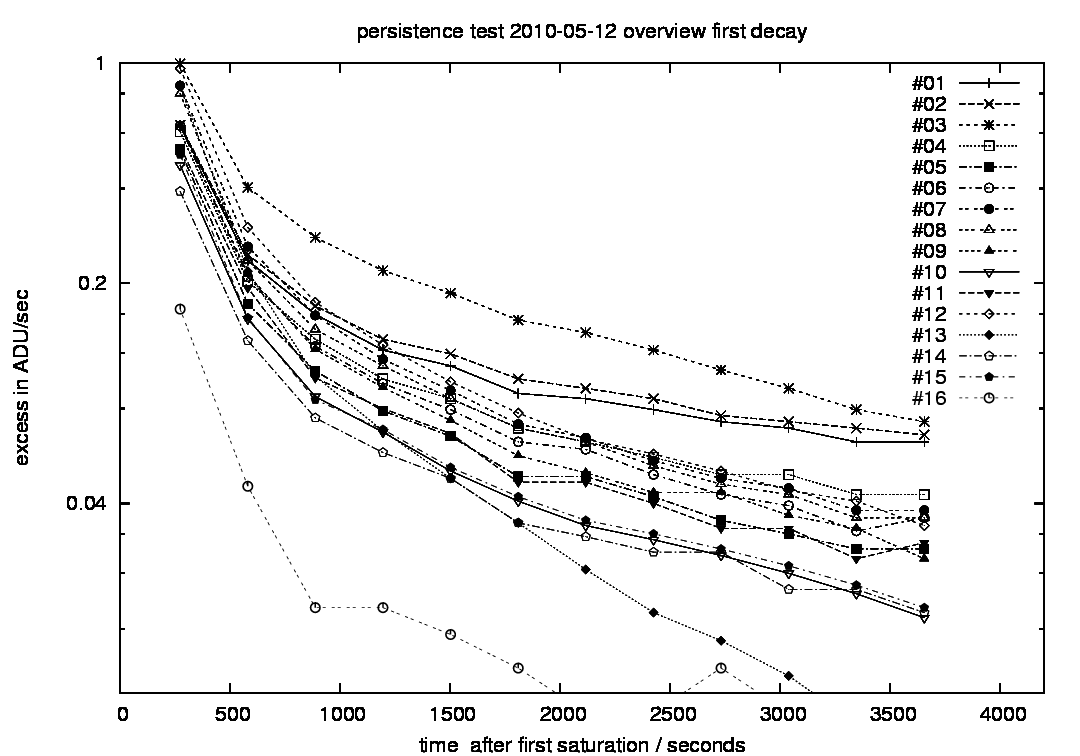
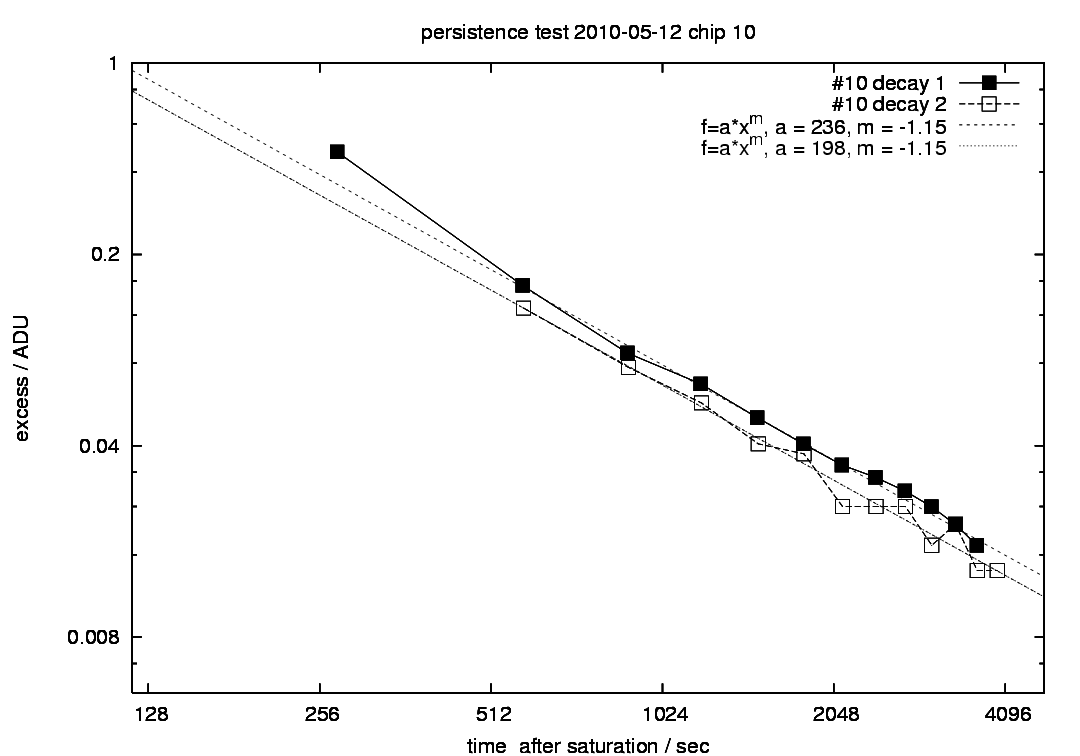
On 2010-05-12, the detector persistence was tested. First five dome flats were taken with DIT=8 sec to measure the flux in ADU/sec and thereafter 5 dome flats with DIT = 80 sec were taken, which results in nominal flux of about 400000 ADU. Thereafter 12 dark frames with DIT = 300 sec were taken to measure the persistence and its decay. The reference dark level that has been subtracted from the measured persistence was retrieved from a dark taken 8 hours later. In the log-ADU versus log-time diagram the decay looks like a straight line, hence the persistence is fit by the arithmetic function (t in sec): P(t) = a * t ^{-m} The best fit parameters a and m are given for the decay sequence in following table, together with the counts for the extrapolated lamp flux f. For the fit of the decay, the first data point acquired after 4 minutes has been excluded from the fit, as it deviates from the trend of all other measurements taken after ~9 min of the saturation.
Left: measured persistence P(t) of all 16 detectors in ADU/sec. Right: Measured persistence of detector #10 for two stimulus events and best fit and best fit parameters a and m. Best fit results of the first decay (filled squares) are given in the table. Some of the VIRCAM detectors are subject of radioactive events. Here we report on the number and the character of the radiation-induced charge collections.The following data have been analyzed:
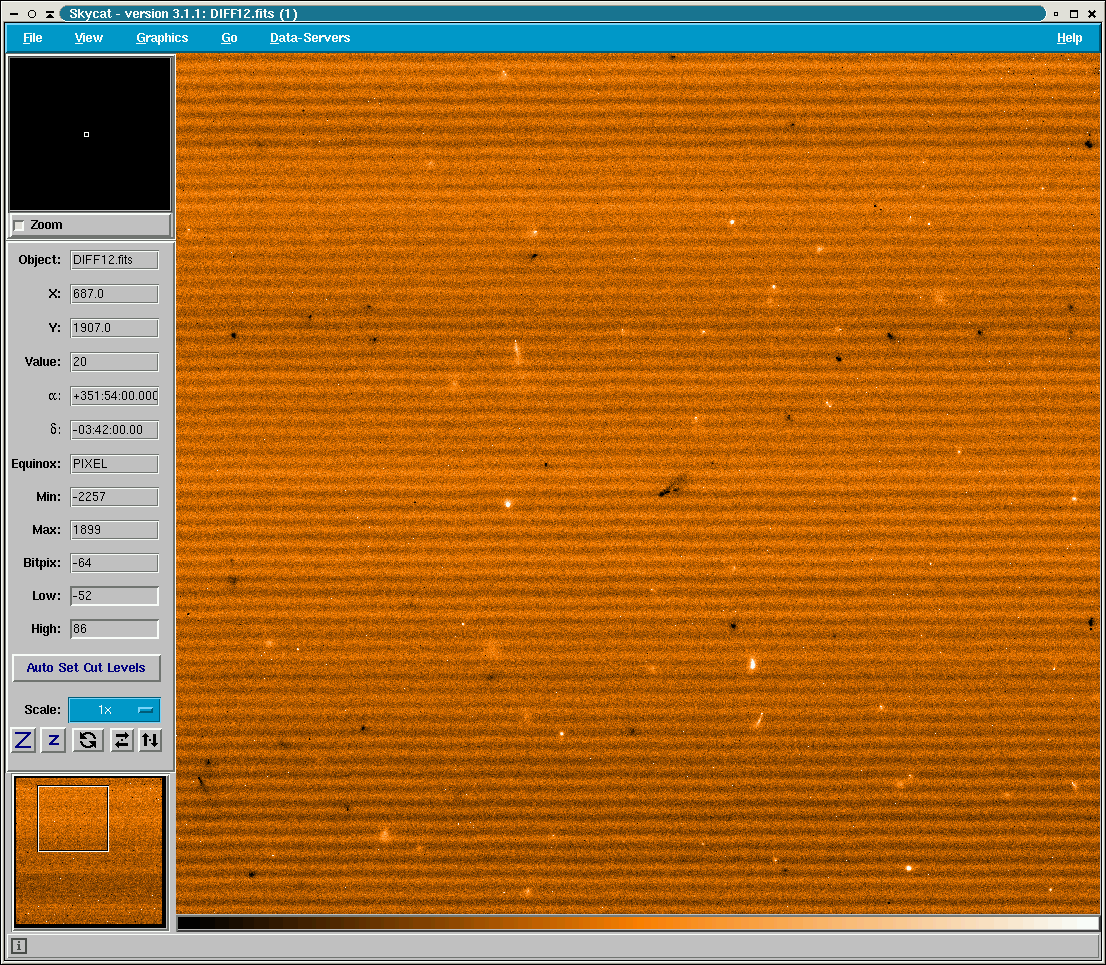
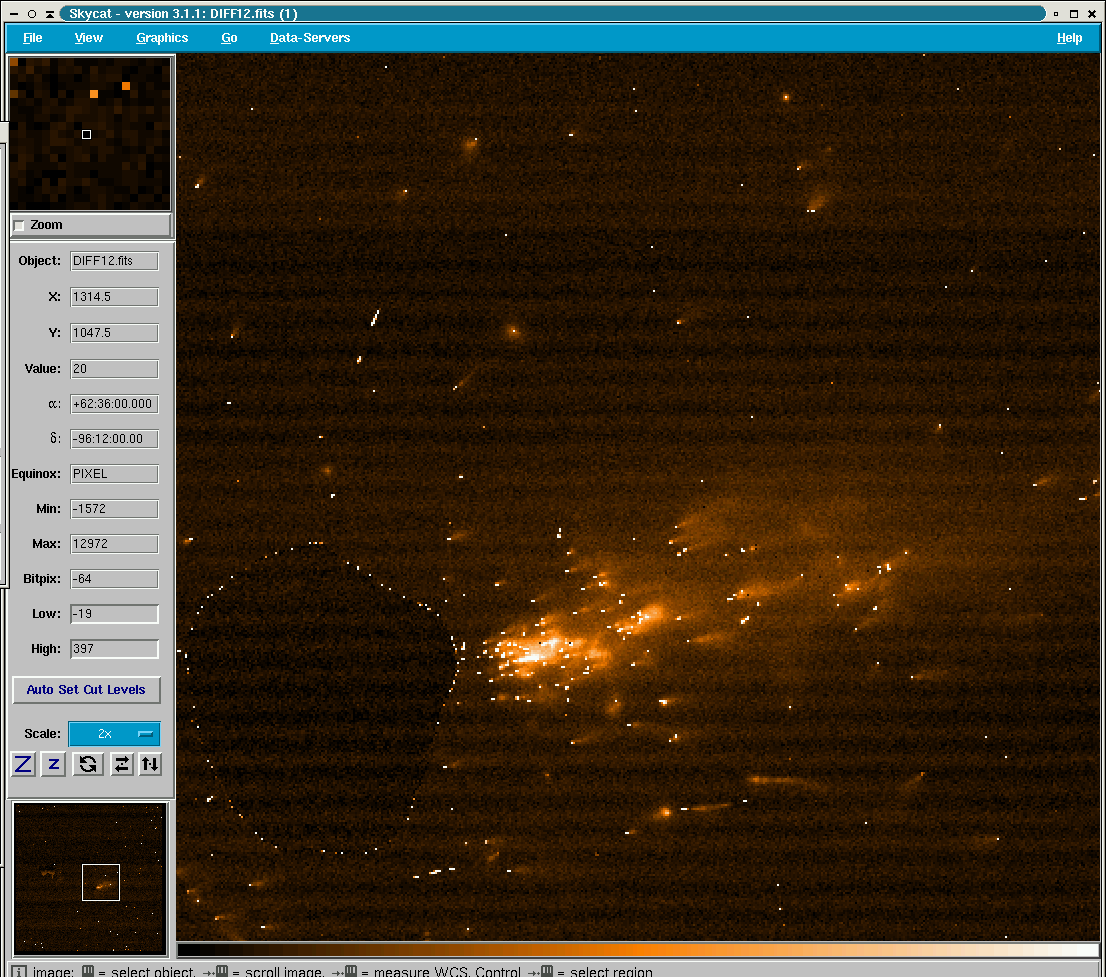
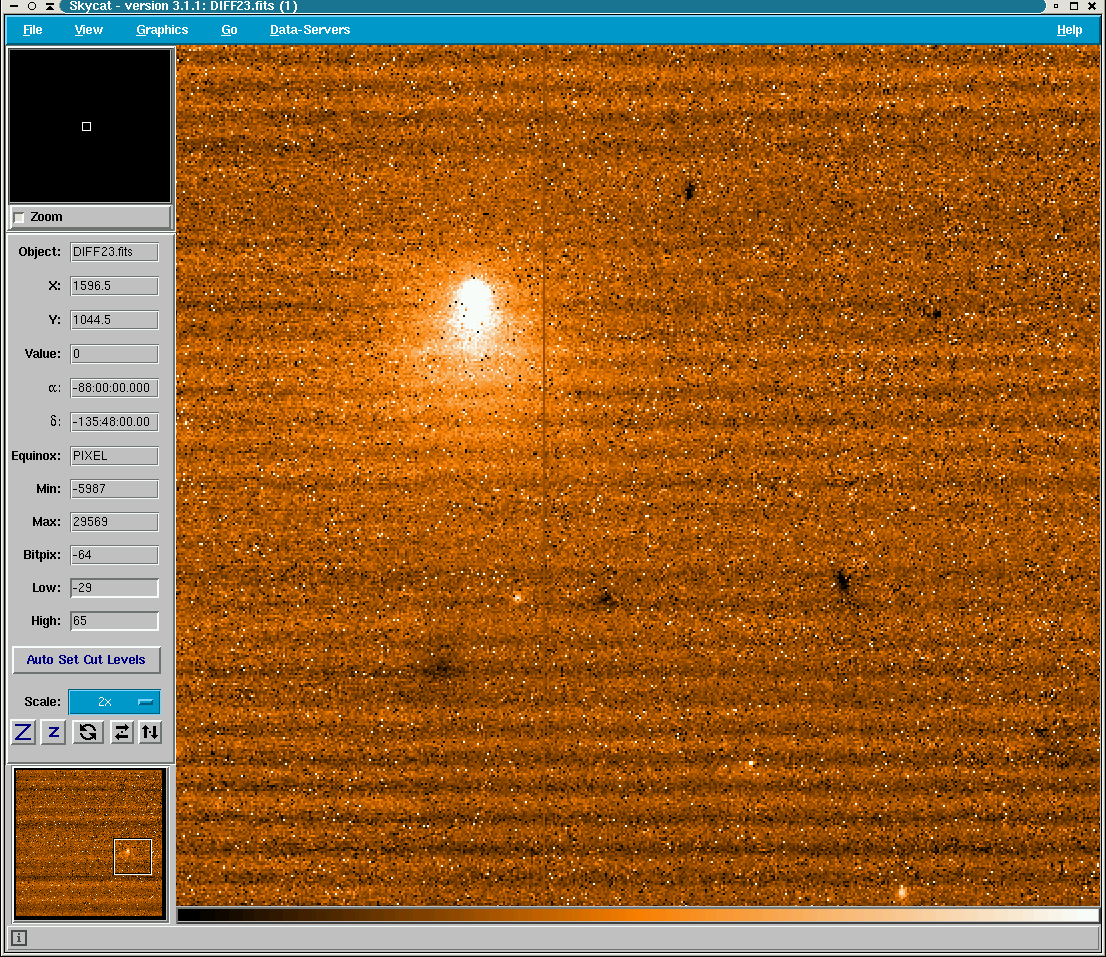
The difference between two VIRCAM raw dark frames with long DIT, show charge collections, in a similar manner as is known for HAWK-I chip #78. Figure caption: Difference of two consecutive VIRCAM dark frames of chip #5 with DIT=300sec The charge collections itself are variable in the number of counts and in the shape. The following number of events per minute have been measured on dark difference from the primary set (Delta n ~ +- sqrt(n)/2 ) :
Beside the normal behavior of the events given in the Figure above, there occurs from time to time more peculiar events collected in the following snapshots: left: crowded event cascades, middle: deep impacts, right: trajectory in detector plane:
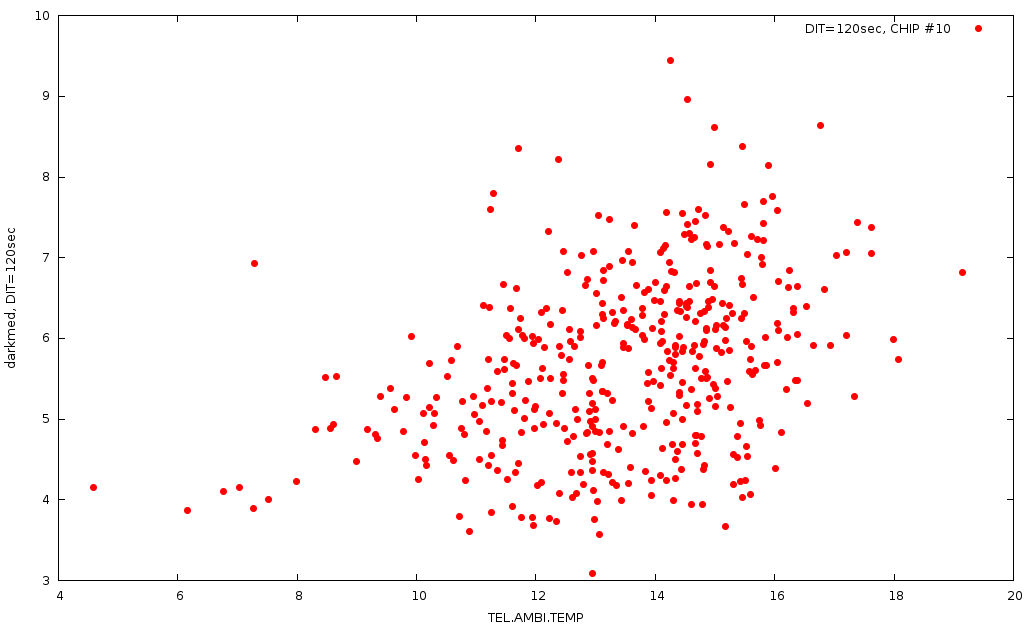
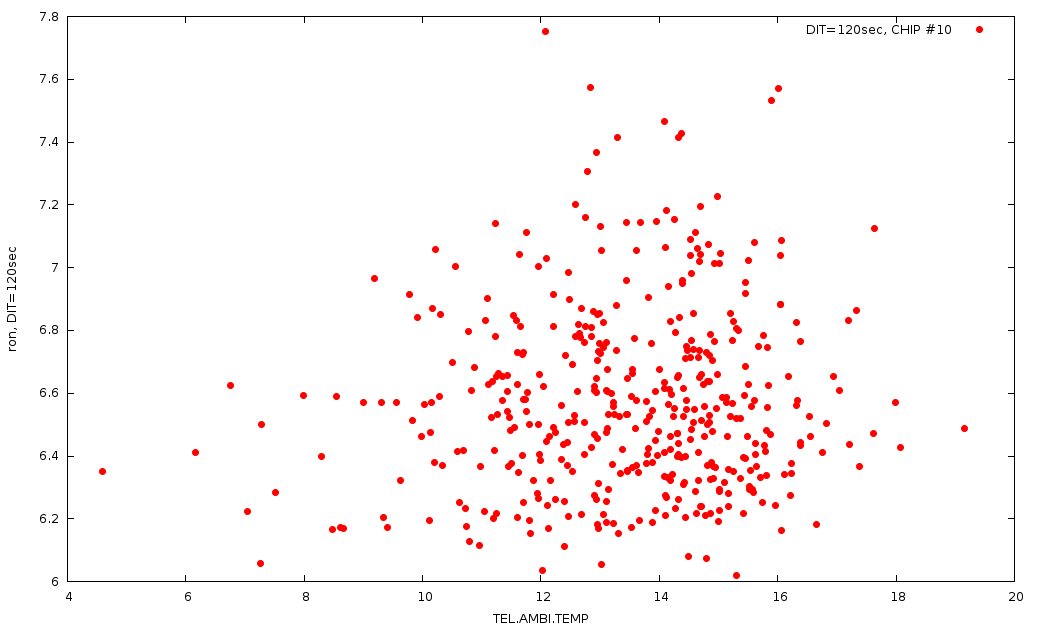
The dark level values show weak dependence on the ambient temperature.
Left: QC parameter qc_darkmed retrieved from dark frames with DIT=120sec of detector #10 versus the ambient temperature. Data are from 2014-07 to 2015-09. |
|||||||||||||||||||||||||||||||||||||||||||||||||||||||||||||||||||||||||||||||||||||||||||||||||||||||||||||||||||||||||||||||||||||||||||||||||||||||||||||||||||||||||||||||||||||||||||||||||||||||||||||||||||||||||||||||||||||||||||||||
 |
||||||||||||||||||||||||||||||||||||||||||||||||||||||||||||||||||||||||||||||||||||||||||||||||||||||||||||||||||||||||||||||||||||||||||||||||||||||||||||||||||||||||||||||||||||||||||||||||||||||||||||||||||||||||||||||||||||||||||||||||