Plot
? |
Symb
? |
Source
* |
Average ? |
Thresholds ? |
N_
data |
QC1
parameter |
Data
downloads |
Remarks |
| method |
value |
unit |
method |
value |
| 1 |
• | QC1DB |
MEDIAN |
0.989 |
fraction |
none | |
1 |
qc_twflat_fluxdep |
this |
last_yr |
all
|
upper chip flux ratio in Ks |
| 2 |
• | QC1DB |
MEDIAN |
0.97 |
fraction |
none | |
1 |
qc_twflat_fluxdep |
this |
last_yr |
all
|
upper chip flux ratio in H |
| 3 |
• | QC1DB |
MEDIAN |
0.686 |
fraction |
none | |
1 |
qc_twflat_fluxdep |
this |
last_yr |
all
|
upper chip flux ratio in J |
| 4 |
• | QC1DB |
MEDIAN |
|
fraction |
none | |
0 |
qc_twflat_fluxdep |
this |
last_yr |
all
|
upper chip flux ratio in NB118 |
| 5 |
• | QC1DB |
MEDIAN |
0.471 |
fraction |
none | |
1 |
qc_twflat_fluxdep |
this |
last_yr |
all
|
upper chip flux ratio in Y |
| 5 |
• | QC1DB |
none |
|
fraction |
none | |
0 |
qc_twflat_fluxdep |
this |
last_yr |
all
|
upper chip flux ratio in NB980 |
| 6 |
• | QC1DB |
MEDIAN |
0.392 |
fraction |
none | |
1 |
qc_twflat_fluxdep |
this |
last_yr |
all
|
upper chip flux ratio in Z |
| |
|
*Data sources: QC1DB: QC1 database; LOCAL: local data source
|
Plot 1
scores: not implemented
| | data source: | vircam_twilight
(QC1 database) |
| dataset: | qc_twflat_fluxdep | • |
| median: | 0.989 | fraction |
| thresholds: | none | |
| N_data plotted: | 1 |
| [click plot for closeup] |
Plot 2
scores: not implemented
| | data source: | vircam_twilight
(QC1 database) |
| dataset: | qc_twflat_fluxdep | • |
| median: | 0.97 | fraction |
| thresholds: | none | |
| N_data plotted: | 1 |
| [click plot for closeup] |
Plot 3
scores: not implemented
| | data source: | vircam_twilight
(QC1 database) |
| dataset: | qc_twflat_fluxdep | • |
| median: | 0.686 | fraction |
| thresholds: | none | |
| N_data plotted: | 1 |
| [click plot for closeup] |
Plot 4
scores: not implemented
| | data source: | vircam_twilight
(QC1 database) |
| dataset: | qc_twflat_fluxdep | • |
| median: | no data | fraction |
| thresholds: | none | |
| N_data plotted: | 0 |
| [click plot for closeup] |
Plot 5
scores: not implemented
| | data source: | vircam_twilight
(QC1 database) |
dataset:
(numbers below apply to this dataset) | qc_twflat_fluxdep | • |
| median: | 0.471 | fraction |
| thresholds: | none | |
| N_data plotted: | 1 |
| [click plot for closeup] |
Plot 6
scores: not implemented
| | data source: | vircam_twilight
(QC1 database) |
| dataset: | qc_twflat_fluxdep | • |
| median: | 0.392 | fraction |
| thresholds: | none | |
| N_data plotted: | 1 |
| [click plot for closeup] |
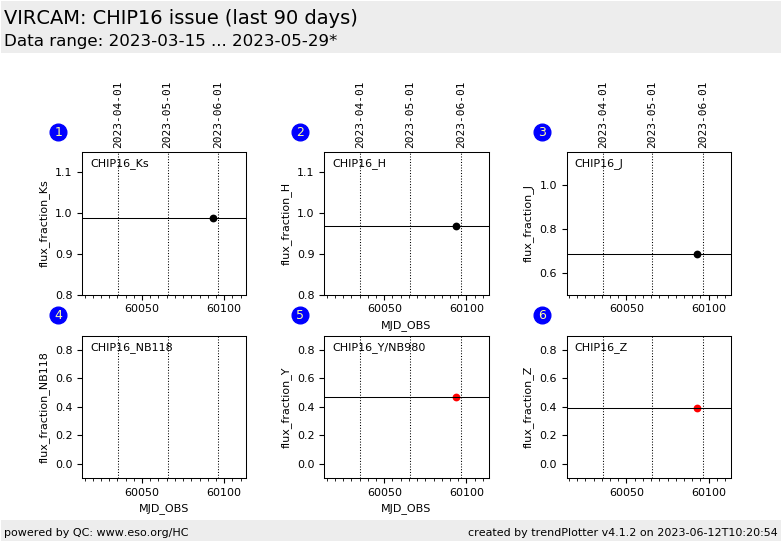
Trending plot for fractional flux in upper part of detector 16.
QC parameters is derived from the master twilight flat of detector #16.
Name:
Fits header: (not available),
QC1 DB: qc_twilight_fluxdep
Description:
Using the (normalized) master twilight flat, the median counts in the following window is given:
xmin=1 ymin=1500 xmax=2048 ymax=2048 , which covers almost the upper part of the
detector.
Setup:
INS.FILT1.NAME = Ks (2.15), H (1.65), J (1.25), NB118 (1.185), Y (1.02) NB980 (0.98), Z (0.88)
As the upper region of detector #16 shows a rather fractal pattern, the
minimum counts in the analysed region are much less than the median value
monitored.The purpose of the plot is to monitor the unpredictable variations
in the blue bands.
Find more information on the VIRCAM TWILIGHT FLAT tutorial page.
and on the VIRCAM QC and problems page.
General information
Click on any of the plots to see a close-up version.
The latest date is indicated on top of the plot.
If configured,
- data points belonging to the latest date are specially marked
- statistical averages are indicated by a solid line, and thresholds by broken lines
- outliers are marked by a red asterisk. They are defined as data points outside the
threshold lines
- "aliens" (= data points outside the plot Y limits) are marked by a red arrow (↑ or ↓)
- you can download the data for each parameter set if the 'Data downloads' link shows up
|
