Plot
? |
Symb
? |
Source
* |
Average ? |
Thresholds ? |
N_
data |
QC1
parameter |
Data
downloads |
Remarks |
| method |
value |
unit |
method |
value |
| 1 |
• | QC1DB |
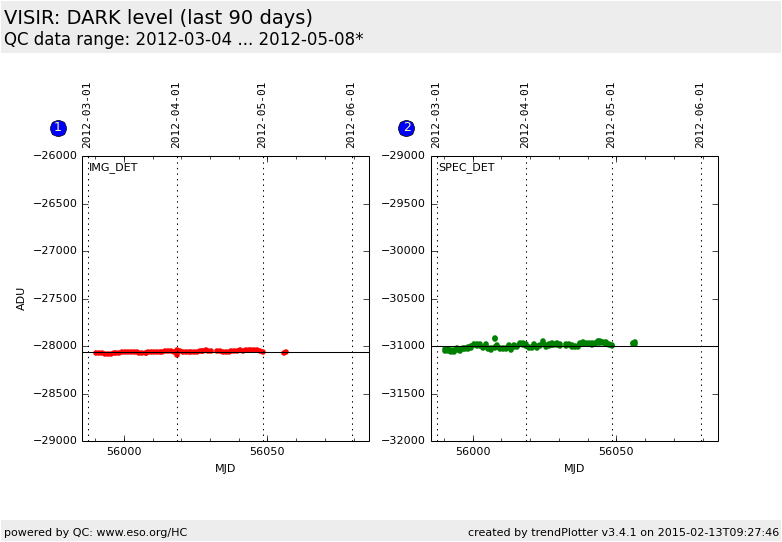
MEDIAN |
-2.81e+04 |
ADU |
none | |
64 |
darkmed |
this |
last_yr |
all
|
median DARK level of the imaging detector |
| 2 |
• | QC1DB |
MEDIAN |
-3.1e+04 |
ADU |
none | |
125 |
darkmed |
this |
last_yr |
all
|
median DARK level of the spectroscopic detector |
| |
|
*Data sources: QC1DB: QC1 database; LOCAL: local data source
|
Plot 1
scores: not implemented
| | data source: | visir_dark_img
(QC1 database) |
| dataset: | darkmed | • |
| median: | -2.81e+04 | ADU |
| thresholds: | none | |
| N_data plotted: | 64 |
| [click on plot for closeup] |
Plot 2
scores: not implemented
| | data source: | visir_dark_spc
(QC1 database) |
| dataset: | darkmed | • |
| median: | -3.1e+04 | ADU |
| thresholds: | none | |
| N_data plotted: | 125 |
| [click on plot for closeup] |
Historical measurements of the dark level with the pre-upgrade
detectors, both for imaging and for spectroscopy.
General information
Click on any of the plots to see a close-up version.
The latest date is indicated on top of the plot.
If configured,
- data points belonging to the latest date are specially marked
- statistical averages are indicated by a solid line, and thresholds by broken lines
- outliers are marked by a red asterisk. They are defined as data points outside the
threshold lines
- "aliens" (= data points outside the plot Y limits) are marked by a red arrow (↑ or ↓)
- you can download the data for each parameter set if the 'Data downloads' link shows up
|

