Plot
? |
Symb
? |
Source
* |
Average ? |
Thresholds ? |
N_
data |
QC1
parameter |
Data
downloads |
Remarks |
| method |
value |
unit |
method |
value |
| 1 |
□ | LOCAL |
none |
|
number |
VAL | VALUE=0,0.15 |
109 |
frac_red |
n/a |
Red-score ABs per instrument. Instruments are sorted by QC scientist (assignments as of 2019-09). QC1: VIRCAM |
| 1 |
o | LOCAL |
none |
|
number |
none | |
94 |
frac_red |
n/a |
NACO (retired) |
| 1 |
▲ | LOCAL |
none |
|
number |
none | |
109 |
frac_red |
n/a |
XSHOOTER |
| 1 |
• | LOCAL |
none |
|
number |
none | |
70 |
frac_red |
n/a |
SPHERE |
|
| 2 |
∗ | LOCAL |
none |
|
number |
VAL | VALUE=0,0.15 |
90 |
frac_red |
n/a |
QC2: KMOS |
| 2 |
o | LOCAL |
none |
|
number |
none | |
109 |
frac_red |
n/a |
VISIR |
| 2 |
♦ | LOCAL |
none |
|
number |
none | |
38 |
frac_red |
n/a |
ESPRESSO |
| 2 |
♦ | LOCAL |
none |
|
number |
none | |
48 |
frac_red |
n/a |
GRAVITY |
| 2 |
□ | LOCAL |
none |
|
number |
none | |
109 |
frac_red |
n/a |
QC5: GIRAFFE |
|
| 3 |
□ | LOCAL |
none |
|
number |
VAL | VALUE=0,0.15 |
21 |
frac_red |
n/a |
QC3: MATISSE |
| 3 |
o | LOCAL |
none |
|
number |
none | |
61 |
frac_red |
n/a |
PIONIER |
| 3 |
▲ | LOCAL |
none |
|
number |
none | |
91 |
frac_red |
n/a |
SINFONI (retired) |
| 3 |
• | LOCAL |
none |
|
number |
none | |
109 |
frac_red |
n/a |
UVES |
|
| 4 |
• | LOCAL |
none |
|
number |
VAL | VALUE=0,0.15 |
109 |
frac_red |
n/a |
QC4: FORS2 |
| 4 |
o | LOCAL |
none |
|
number |
none | |
109 |
frac_red |
n/a |
HAWKI |
| 4 |
∗ | LOCAL |
none |
|
number |
none | |
109 |
frac_red |
n/a |
OMEGACAM |
| 4 |
◊ | LOCAL |
none |
|
number |
none | |
73 |
frac_red |
n/a |
MUSE |
| |
|
*Data sources: QC1DB: QC1 database; LOCAL: local data source
|
| Plot 1 | | data source: | local data source
|
dataset:
(numbers below apply to this dataset) | frac_red | □ |
| average: | none |
| fixed thresholds: | 0...0.15 | number |
| N_data plotted: | 109 |
| [click plot for closeup] |
| Plot 2 | | data source: | local data source
|
dataset:
(numbers below apply to this dataset) | frac_red | ∗ |
| average: | none |
| fixed thresholds: | 0...0.15 | number |
| N_data plotted: | 90 |
| [click plot for closeup] |
| Plot 3 | | data source: | local data source
|
dataset:
(numbers below apply to this dataset) | frac_red | □ |
| average: | none |
| fixed thresholds: | 0...0.15 | number |
| N_data plotted: | 21 |
| [click plot for closeup] |
| Plot 4 | | data source: | local data source
|
dataset:
(numbers below apply to this dataset) | frac_red | • |
| average: | none |
| fixed thresholds: | 0...0.15 | number |
| N_data plotted: | 109 |
| [click plot for closeup] |
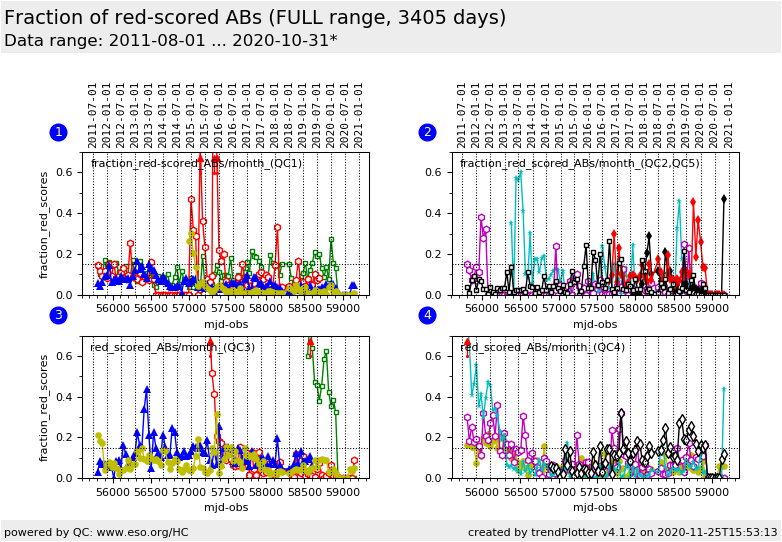
This plot visualizes the fraction of red-scored calibration ABs per instrument. The
instruments are grouped by assignment (as per 2013-09). The fractions are
defined as the ratio of red-score ABs over grand total of all scored ABs.
The purpose of this plot is to monitor the significance of the scoring system
for a given instrument. Usually a system with red-score fraction below 15% is
considered a mature and significant system. This value is indicated by the
broken line. There could be exceptions but these then need to be clearly
understood.
Note: The latest data point in the current plot usually refers to a month which is not yet finished.
Its value will therefore continue to increase until a new last month starts.
General information
Click on any of the plots to see a close-up version.
The latest date is indicated on top of the plot.
If configured,
- data points belonging to the latest date are specially marked
- statistical averages are indicated by a solid line, and thresholds by broken lines
- outliers are marked by a red asterisk. They are defined as data points outside the
threshold lines
- "aliens" (= data points outside the plot Y limits) are marked by a red arrow (↑ or ↓)
- you can download the data for each parameter set if the 'Data downloads' link shows up
|
