Plot
? |
Symb
? |
Source
* |
Average ? |
Thresholds ? |
N_
data |
QC1
parameter |
Data
downloads |
Remarks |
| method |
value |
unit |
method |
value |
| 1 |
• | QC1DB |
MEAN |
1.9e+05 |
MB |
none | |
89 |
dataflow_ALL |
this |
last_yr |
all
|
1. daily data volume (all VLT+VLTI, no survey cameras, compressed MBytes)
a) all data |
| 1 |
o | QC1DB |
none |
|
MB |
none | |
89 |
dataflow_CAL |
this |
last_yr |
all
|
b) CAL only (UT 0.40...0.99) |
| 1 |
o | QC1DB |
none |
|
MB |
none | |
89 |
dataflow_SCI |
this |
last_yr |
all
|
c) SCI only (UT 0.00...0.39) |
|
| 2 |
• | QC1DB |
MEAN |
1.9e+05 |
MB |
none | |
89 |
dataflow_ALL |
this |
last_yr |
all
|
2. Instruments with burst modes (SCI plus CAL, compressed MBytes)
a) all data |
| 2 |
o | QC1DB |
none |
|
MB |
none | |
89 |
dataflow_ALL |
this |
last_yr |
all
|
b) MUSE only |
| 2 |
o | QC1DB |
none |
|
MB |
none | |
89 |
dataflow_ALL |
this |
last_yr |
all
|
c) ESPRESSO only |
| 2 |
o | QC1DB |
none |
|
MB |
none | |
89 |
dataflow_ALL |
this |
last_yr |
all
|
d) VISIR only |
| 2 |
o | QC1DB |
none |
|
MB |
none | |
89 |
dataflow_ALL |
this |
last_yr |
all
|
e) HAWKI only |
| 2 |
o | QC1DB |
none |
|
MB |
none | |
89 |
dataflow_ALL |
this |
last_yr |
all
|
f) VLTI only (AMBER/GRAVITY/PIONIER/MATISSE) |
|
| 3 |
• | QC1DB |
MEAN |
0 |
MB |
none | |
89 |
dataflow_ALL |
this |
last_yr |
all
|
3. VIRCAM@VISTA (compressed MBytes)
a) all VIRCAM data |
| 3 |
• | QC1DB |
none |
|
MB |
none | |
89 |
dataflow_CAL |
this |
last_yr |
all
|
b) CAL only (UT 0.40...0.99) |
| 3 |
• | QC1DB |
none |
|
MB |
none | |
89 |
dataflow_SCI |
this |
last_yr |
all
|
c) SCI only (UT 0.00...0.39) |
|
| 4 |
• | QC1DB |
MEAN |
3.68e+04 |
MB |
none | |
89 |
dataflow_ALL |
this |
last_yr |
all
|
4. OMEGACAM@VST (compressed MBytes)
a) all OMEGACAM data |
| 4 |
• | QC1DB |
none |
|
MB |
none | |
89 |
dataflow_CAL |
this |
last_yr |
all
|
b) CAL only (UT 0.40...0.99) |
| 4 |
• | QC1DB |
none |
|
MB |
none | |
89 |
dataflow_SCI |
this |
last_yr |
all
|
c) SCI only (UT 0.00...0.39) |
| |
|
*Data sources: QC1DB: QC1 database; LOCAL: local data source
|
| Plot 1 | | data source: | dataflow_stat
(QC1 database) |
dataset:
(numbers below apply to this dataset) | dataflow_ALL | • |
| mean: | 1.9e+05 | MB |
| thresholds: | none | |
| N_data plotted: | 89 |
| [click plot for closeup] |
| Plot 2 | | data source: | dataflow_stat
(QC1 database) |
dataset:
(numbers below apply to this dataset) | dataflow_ALL | • |
| mean: | 1.9e+05 | MB |
| thresholds: | none | |
| N_data plotted: | 89 |
| [click plot for closeup] |
| Plot 3 | | data source: | dataflow_stat
(QC1 database) |
dataset:
(numbers below apply to this dataset) | dataflow_ALL | • |
| mean: | 0 | MB |
| thresholds: | none | |
| N_data plotted: | 89 |
| [click plot for closeup] |
| Plot 4 | | data source: | dataflow_stat
(QC1 database) |
dataset:
(numbers below apply to this dataset) | dataflow_ALL | • |
| mean: | 3.68e+04 | MB |
| thresholds: | none | |
| N_data plotted: | 89 |
| [click plot for closeup] |
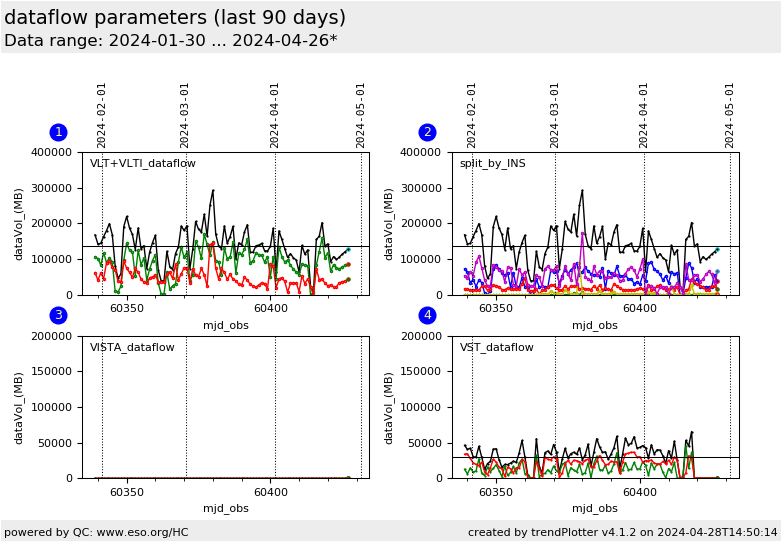
This plot visualizes the daily data volume, in compressed MBytes, created by VLT and VLTI (plots 1 and 2), by VISTA (plot 3) and by the VST (plot 4). The
data volume is read from the ngas_files database table. It refers to
compressed files and represents the data volume relevant for transfer.
Since July 2008, VLT/VLTI data are transfered via the internet, before they
were sent on disks. Since March 2012, the EVALSO fibre link serves all Paranal data (including VIRCAM and OMEGACAM)
over the internet.
Plot 1: The data stream is divided into "ALL" data; "SCIENCE" (all data acquired between mjd.00
... mjd.40), and "CALIBRATION" (all other data).
Plot 2: The data stream for instruments with burst modes. Peaks almost always
refer to burst mode observations of a single instruments. That instrument can
be identified in this plot.
Plots 3,4: As plot 1, the VIRCAM and OMEGACAM data streams are divided into ALL, SCIENCE and
CALIBRATION.
Until 2011, the thin broken line in the history plots marks the data volume equivalent to a 10.0 Mbit/s
continuous transfer
(before EVALSO, this was the bandwidth for data transfer of the
connection Paranal - Antofagasta).
General information
Click on any of the plots to see a close-up version.
The latest date is indicated on top of the plot.
If configured,
- data points belonging to the latest date are specially marked
- statistical averages are indicated by a solid line, and thresholds by broken lines
- outliers are marked by a red asterisk. They are defined as data points outside the
threshold lines
- "aliens" (= data points outside the plot Y limits) are marked by a red arrow (↑ or ↓)
- you can download the data for each parameter set if the 'Data downloads' link shows up
|
