NOTE: The Health Check and calChecker services are moved to qcFlow on an instrument by instrument basis. The current pages will not be updated any longer once the move has been finished.
- advanced studies:QC1 browser |
QC1 plotter
- dfoMonitor |
calChecker
- All WISQ plots are updated once per day. The links 'Data downloads' might offer more recent data than plotted, since the database is fed by other processes than the plot process.
*Data sources: QC1DB: QC1 database; LOCAL: local data source
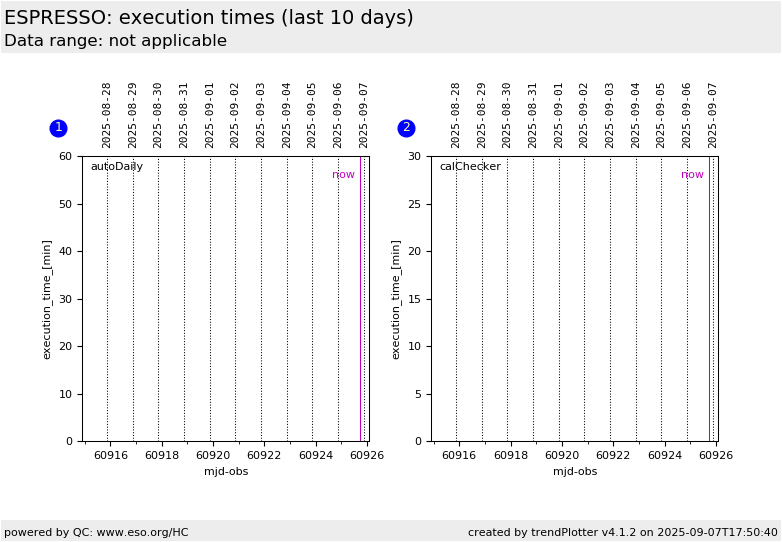
Plot 1
data source:
exec_time (QC1 database)
dataset:
exec_time
•
median:
no data
min
thresholds:
none
N_data plotted:
0
[click plot for closeup]
Plot 2
data source:
exec_time (QC1 database)
dataset:
exec_time
•
median:
no data
min
thresholds:
none
N_data plotted:
0
[click plot for closeup]
This plot
This plot visualizes the execution times for the dfos tools autoDaily and
calChecker. Their median values should be monitored to be well below the
current execution pattern (autoDaily: one hour, calChecker: half an hour).
General information
Click on any of the plots to see a close-up version.
The latest date is indicated on top of the plot.
If configured,
data points belonging to the latest date are specially marked
statistical averages are indicated by a solid line, and thresholds by broken lines
outliers are marked by a red asterisk. They are defined as data points outside the
threshold lines
"aliens" (= data points outside the plot Y limits) are marked by a red arrow (↑ or ↓)
you can download the data for each parameter set if the 'Data downloads' link shows up
