[page auto-refreshes after 300 sec]   [stop | on]            [press Ctrl+Shift+R to enforce refresh of scores, dates and news]
XSHOOTER trending system: HEALTH CHECK report
HELP USERS-GUIDE MORE
Last update: 2025-09-11T22:36:15 (UT)
  | now: 2025-09-12T06:32:04 (UT) muc02 QC pipeline: xshoo-3.6.5a (installed 2023-09-18)
same group: bias_AGC dark_AGC detmon_AGC
close window history: 2014 2015 2016 2017 2018 2019 2020 2021 2022 2023 2024   2025   HEALTH
  ... ... ... ... ... ... ... ... ... ...
*Date on this monitor changes at 21:00 UT
png: Information and research:
- png file - advanced studies: QC1 browser | QC1 plotter
Plot
?
Symb
?
Source
*
Average ? Thresholds ? N_
data
QC1
parameter
Data
downloads
Remarks
method value unit method value
1 QC1DB none   ADU/sec none  8 median_dark this | last_yr | all dark current in ADU
1 oQC1DB MEDIAN   ADU/sec none  0 median_dark this | last_yr | all dark current in ADU, exptime=10sec values only
2 QC1DB none   ADU none  8 median_dark this | last_yr | all non-linear behaviour dark(exptime)
4 QC1DB none   ADU none  8 median_dark this | last_yr | all non-linear behaviour dark(exptime)
*Data sources: QC1DB: QC1 database; LOCAL: local data source
Plot 1
scores: not implemented
data source:xshooter_dark
(QC1 database)
dataset:
(numbers below apply to this dataset)
median_dark
average:none
thresholds:none
N_data plotted:8
[click plot for closeup]
Plot 2
scores: not implemented
data source:xshooter_dark
(QC1 database)
dataset:median_dark
average:none
thresholds:none
N_data plotted:8
[click plot for closeup]
Plot 4
scores: not implemented
data source:xshooter_dark
(QC1 database)
dataset:median_dark
average:none
thresholds:none
N_data plotted:8
[click plot for closeup]
This plot

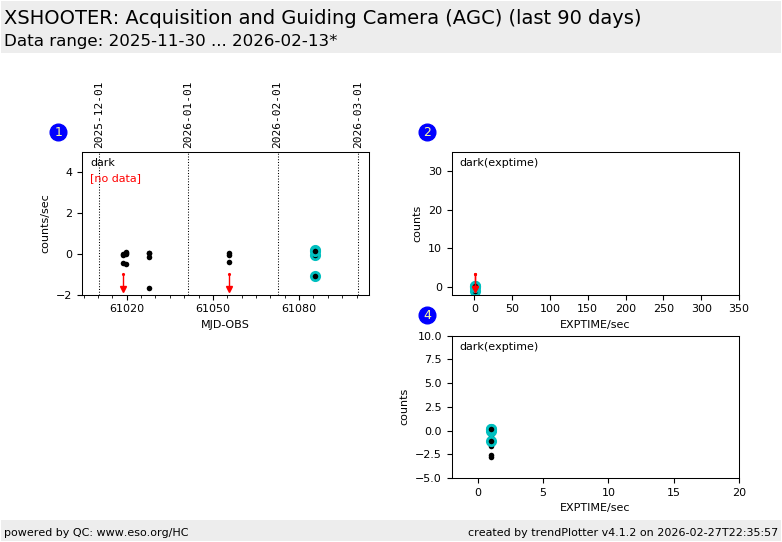
This plots shows detector related QC parameters derived from DARK health check calibrations of the xshooter acquisition and guiding camera (AGC). It is a 562 x 528 pixel technical CCD. For the definition of the QC parameters, please see the corresponding section of the UVB-arm and VIS-arm science detector. On 2014-01-09 the detector operations mode was switched from DET.OUT1.GAININD = 8 to DET.OUT1.GAININD = 4.  


General information

Click on any of the plots to see a close-up version.

The latest date is indicated on top of the plot.

If configured,

  • data points belonging to the latest date are specially marked
  • statistical averages are indicated by a solid line, and thresholds by broken lines
  • outliers are marked by a red asterisk. They are defined as data points outside the threshold lines
  • "aliens" (= data points outside the plot Y limits) are marked by a red arrow ( or )
  • you can download the data for each parameter set if the 'Data downloads' link shows up