The software has been tagged with ALMA-R4_0.
These are the patches we received and integrated subsystem per subsystem:
|
SUBSYSTEM NAME |
TAG (corresponding to the last bug fixing) |
|
TELCAL |
MONTHLY-2006-09-1 |
|
SCHEDULING |
MONTHLY-2006-09-1 |
|
ARCHIVE |
MONTHLY-2006-09-2 |
|
ACACORR |
MONTHLY-2006-09-6 |
|
OBOPS |
MONTHLY-2006-09-5 |
|
ITS |
MONTHLY-2006-09-1 |
To validate the software delivered
for R4, the tests from the validation tests suite at the ITS
twiki page have been run.
A) Short summary:
| Number | Test | Type | Result |
| 1 | MDB 0th order test | simple test on sending monitor points to the archive | PASS |
| 2 | APDM test | check on the consistency of the APDM | PASS |
| 3 | Control-DataCapturer test | mini-integration test | FAIL |
| 4 | Optical Pointing e2e test | e2e test processing an OP SB | FAIL |
| 5 | Shared Simulator e2e test | e2e test processing an SS SB | FAIL |
| 6 | Holography e2e test | e2e test processing an HG SB | FAIL |
| 7 | ACACORR integration test | tests suite on the ACACORR software | PASS |
Percentage of success on the total number of tests: 42.86%
Important remark: the e2e tests 4 to 6 do not have yet the validation of the ASDM produced during the test. At the moment, the validation has to be done manually by people who know enough about the ASDM, after the test has been run. If the e2e test passes, but the validation of the ASDM fails or is missing, the e2e test is marked as FAIL.
It has been agreed that the validation tests in the test suite should all pass.
Therefore, R4 is not completed and should not be released to anybody.
B) Detailed summary with problems encountered:
There are some problems but the test passes.
This test passes but again it relies on the dbConfig.properties with almadev1 (archive machine in Garching).
It does not pass.
There is an error in the script. From the java container log, one can see:
2006-10-10T11:30:20.224
INFO [CONTROL/DataCapture001] DataCapturer CONTROL/DataCapture001: startSBExecution
- uid://X0000000000000010/X00000000
ping received, container alive. Memory usage 3323 of 4356 kB (= 5.1% of JVM
growth limit 65088 kB)
2006-10-10T11:30:32.216 SEVERE [CONTROL/Array001] Execution error
2006-10-10T11:30:32.265 ERROR [java 1.5.0_04] (type=10100, code=5)
2006-10-10T11:30:31.055 ERROR [24735] General ScriptExecutor runtime error
(type=10100, code=5)
2006-10-10T11:30:31.051 ERROR [24735] Python error (type=10100, code=6)
2006-10-10T11:30:31.046 ERROR [24735] Python error (type=10100, code=6)
2006-10-10T11:30:31.041 ERROR [24735] Python error (type=10100, code=6)
2006-10-10T11:30:31.036 ERROR [24735] Python error (type=10100, code=6)
...
2006-10-10T11:32:33.370 SEVERE [CONTROL/Array001] Timeout when waiting for
the scheduling block execution to finish
and the python container log says:
2006-10-10T11:30:19.000
CONTROL/ACC/pythonContainer activate_component -Activated component: CONTROL/IERS
2006-10-10T11:30:31.000 ScriptExecutor runSource - Other exception!!!
2006-10-10T11:30:31.000 ScriptExecutor runSource -
ErrorTrace:
-----------
ErrorTrace 1:
File = ../lib/python/site-packages/ScriptImpl/ScriptExecutor.py
Line number = 566
Routine = runSource
Host = gcn
Process = 24735
Thread = omniORB--1256346704
TimeStamp = 133797726310550480
ErrorType = 10100
ErrorCode = 5
Severity = Error
Short decription = General ScriptExecutor runtime error
Data:
ErrorTrace 2:
File = '../lib/python/site-packages/ScriptImpl/ScriptExecutor.py'
...
a) SS manual and automatic tests can be run and produced an ASDM; validation is missing
b) OP manual test can be run and produce an ASDM; validation is missing
c) HG fails with a python script error
It is still missing. Looking with the browser at the ASDM produced there are clearly problems (the OP asdm looks pretty empty). In principle, one should have checked the ASDM produced, should have produced new fixes, rerun the e2e test and produced new asdms, re-checked them. This loop was missing because most of the relevant people for that were busy with other stuff.
6) The OMC GUI has problems when using the ACS_LOG_STDOUT=2. This one is the highest logging level and the OMC GUI is flooded with messages that it cannot handle. I had to unset the ACS_LOG_STDOUT to be able to run the e2e tests.
7) Once it happened that, after a couple of hours the system was running, the antenna began to issue the following messages:
2006-10-19T11:10:27.342
[CONTROL/ALMA01/MountController/Mount] Timed out waiting for nextRequest.This
is a major problem and should not be happening.
2006-10-19T11:22:37.713 Failed to create cache logginger. Logging cache is
lost!
at a very high rate and this flooded
as well the OMC GUI with the same results as in 6): the GUI got frozen and
it was impossible to operate with it.
8) the new scheduling panel has been tested only in the basic functionality of the interactive scheduling. There could be some SPRs to open.
9) the Shift Log tool has been integrated with the rest of the software and tested. Comments have been submitted to Maurizio. An SPR has also been open.
10) the ACACORR has been tested with integration tests prepared by the ACACORR team. Carlita did most of the job in this case. All integration tests pass.
11) archiveLoggingCli: it
seems the situation has not changed from the previous tests (done end of August).
Archive people plan to check-in the corrections to the SPR I submitted end
of August for ACS 6.0. Next week, Viola and myself should give a try to what
is actually checked in the HEAD. The CDB has been changed in order to have
the ARCHIVE_LOG_STORE component automatically started. I archived the modification
but I still have to test that it works.
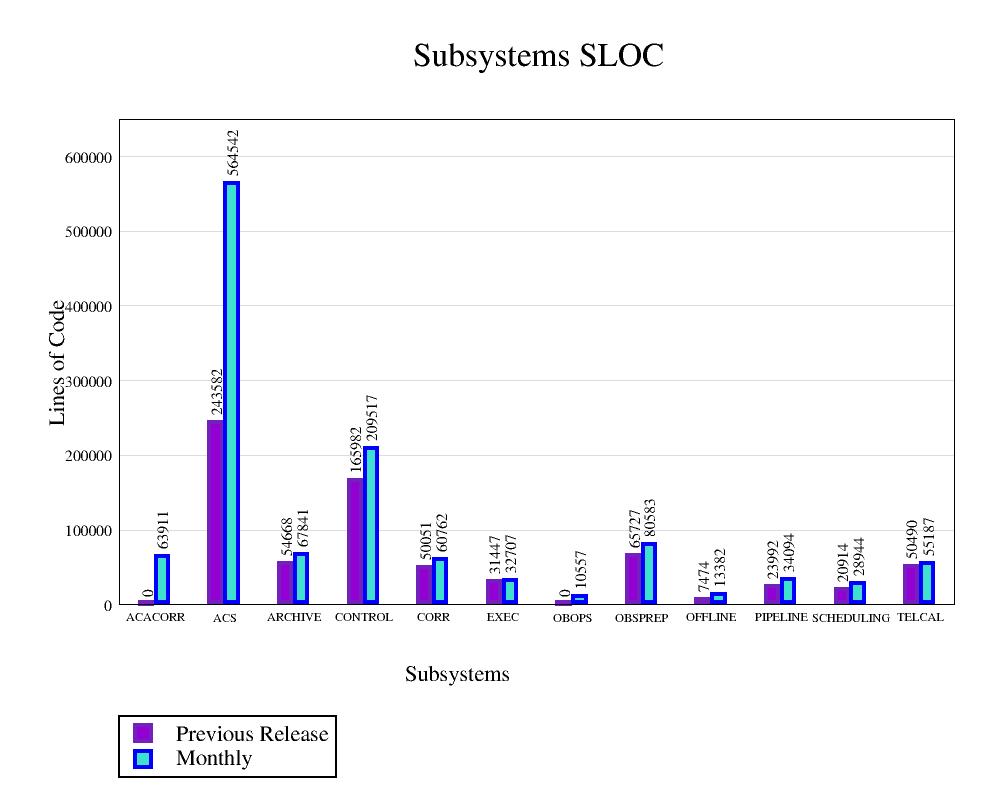
SLOC detailed figures:
Note: Starting from Release R1.1 ITS and SE have used a common approach in calculating SLOC.
Assessment on the sufficiency of Doxygen-like in-line documentation: Graph
|
Modules inline |
Global inline |
See the log at this link.
You will have a page with the results per each subsystem (see list below). In this page of results, there is a table with 3 columns:
- the first one lists the modules belonging to the subsystem,
- the second gives the results of the tests (PASSED, FAILED, UNDETERMINED, when it is neither PASSED nor FAILED); sometimes the test directory can be missing, so you will just see the message: "No test directory, nothing to do here".
- the third one gives a resume produced by Purify/Coverage reporting the analysis results on:
Functions
Functions and exits
Statement blocks
Implicit blocks
Decisions
Loops
The values reported for every item in the list above give the number of hits for that item.
In the same cell with the resume there is a link to the "Complete Report" produced by Purify. In the Complete Report one has information about the lines where the hit happened. For a loop, one has also the values: 0 (the loop is executed without entering into it), 1 (the loop is entered once), 2+ (the loop is entered and repeated once or more times).
Sometimes, instead of the resume, you will see a message like:
ERROR: No coverage info available
No atlout.spt
This happens when the modular test of that module is a fake one (for example the test is actually just an "echo something"), so there is no code (Java, Python or Cpp) that can be instrumented.
Note: the Test Coverage Analysis is not yet stable. Work is in progress to improve the results. You will see errors like:
This means that the test exists and is executed but Purify is not able to dump the information collected in the result file. This error is under investigation. We had 5 cases in ACS only
still under investigation, we don't know yet the reasons
We hope to clarify the problems under investigation as soon as possible!
See the list at this link.
See details at this link.