

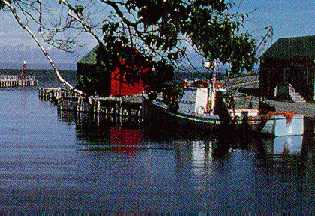
Tides are slow-moving water waves with long wavelengths. They produce an alternate rise and fall in the surface level of the oceans. When the tide comes in, the water level rises and the tides break further and further inland. At the point when the surface level of the ocean is at its highest point, it is high tide. Once the high point has been reached, the tides begin to subside. When the water surface level reaches its lowest point it is low tide. The tide is caused by the pull of the sun and the moon on the oceans, and the rotation of the earth, but its exact pattern at any particular spot on the coast depends very strongly on the shape of the coastline and on the profile of the sea floor nearby. The figure above shows the tide effect in the Halls harbour of Nova Scotia with a time interval of six hours.
![[Diagram - Spring Tide]](../img/tide4.gif)
![[Diagram - Neap Tide]](../img/tide5.gif)
People going into or out of a harbor, or anchoring near a shore, need to know in advance about the behaviour of the tide.
![[Image - ERS-1 Satellite]](../img/ers1.gif)
The image below shows the Thames Estuary. It has been taken by the Radar aboard the ERS satellite built and launched by the European Space Agency. Radar-images look similar to photographs but their interpretation is different (see the Radar Mini-Tutorial).
In a radar image the ocean is not blue but black and white and also has a lot of strange features. Radars are not sensitive to colours but, strange enough, to surface roughness. A sea surface is rough in presence of waves generated by wind, and is smooth in absence of wind. As a principle for interpretation: the rougher the sea the brighter it appears in a radar image.
However our image (below) is coloured! This is because it is composed by 3 images taken at 3 different days. In order to still distinguish the information (essentially roughness) acquired on each of these days, each image was given a different colour:
Let us inspect the image with the Red, Green and Blue lenses. Explore the coast line: can you detect any difference between the dates?
On the three dates, at 10.52 GMT, Harwich observed the following tide (not in order!!!)
![[Thames Estuary - Image]](ex4.jpeg)
If your browser supports JAVA, you can view the applet that permits you to see the individual channels and the map. Otherwise you can simply view the map.
ExercisesMatch the dates to the corresponding tide. Fill the following form: |
![[Diagram - Sea bottom features]](../img/fig4.gif)
Observe the features in the sea: it seems that the sea is not flat, there is some kind of relief visible! As if it is the sea bottom. But this is not possible, since the Radar-waves are microwaves and will not penetrate at all the water. What we see is just the sea surface. Due to the tidal current that flows in and out the estuaries and moves also through the North Sea, there is a huge water flow across the Dover Strait.
This flow is disturbed by hidden sandbanks, and this is exactly what you see in the image. This disturbance is translated into surface roughness change (small waves appear near this hidden sandbanks, as the water flows over them). Compare the sea features with the map. Measure the size (length and width) in the image and also in the map and compose a table:
Exercise
Name: | |||||||||||||||||||||||||||||||||||
After completing the exercise show it to your professor and then discuss it with your school mates and compare the results.