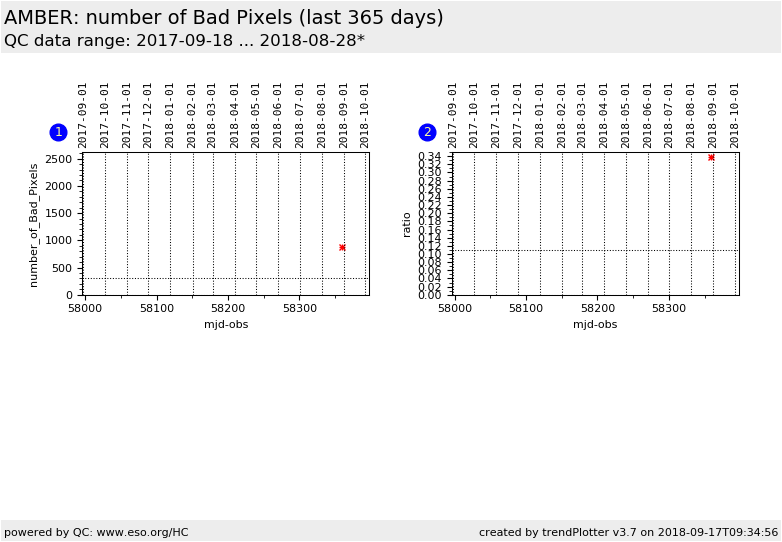
The number of Bad Pixels is monitored and is extracted from the calibration darks and Flat Field.
The AMBER detector is 512x512, the scale of the left plot is 3.5% of the detector
These data are taken once a period in average.
General information
Click on any of the plots to see a close-up version.
The latest date is indicated on top of the plot.
If configured,
data points belonging to the latest date are specially marked
statistical averages are indicated by a solid line, and thresholds by broken lines
outliers are marked by a red asterisk. They are defined as data points outside the
threshold lines
"aliens" (= data points outside the plot Y limits) are marked by a red arrow (↑ or ↓)
you can download the data for each parameter set if the 'Data downloads' link shows up
