*Data sources: QC1DB: QC1 database; LOCAL: local text file | **OPS: to indicate that OPSLOG data are included
This plot
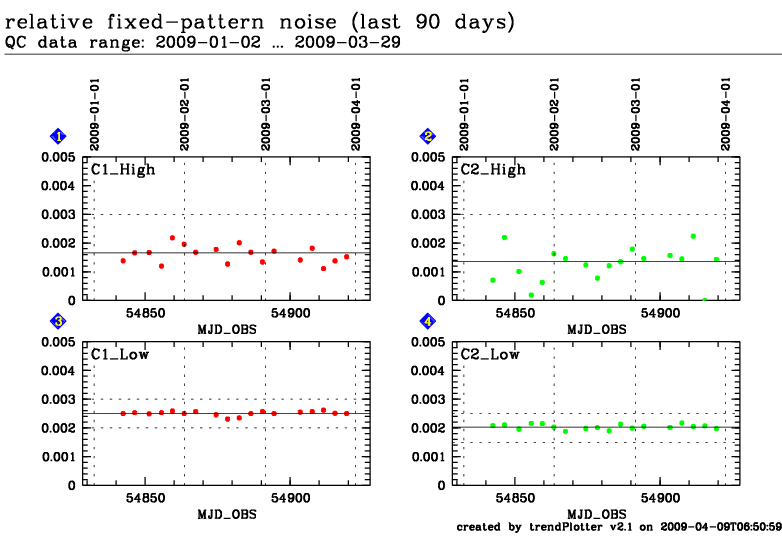
The fixed-pattern noise is computed in the following way: The
difference of two 100x100 sub-frames of the same master flat field
image is determined. These two sub-frames are are shifted with respect
to each other by 10 pixels in X- and Y-direction. The population
standard deviation of the difference frame, divided by the square root
of 2, minus the photon noise (geometrically subtracted) yields the
fixed-pattern noise, which is then divided by the median of the
respective region.
General information
Click on any of the plots to see a close-up version.
The latest date is indicated on top of the plot, data points belonging to that date are specially marked.
If configured,
statistical averages are indicated by a solid line, and thresholds by broken lines
outliers are marked by a red asterisk. They are defined as data points outside the
threshold lines
"aliens" (= data points outside the plot Y limits) are marked by a red arrow (↑ or ↓)
you can download the data for each parameter set if the 'Data downloads' link shows up
