Plot
? |
Symb
? |
Source
* |
Average ? |
Thresholds ? |
N_
data |
QC1
parameter |
Data
downloads |
Remarks |
| method |
value |
unit |
method |
value |
| 1 |
• | QC1DB |
none |
|
e-/hr/px |
VAL | -3,10 |
16 |
dark_avg |
this |
last_yr |
all
|
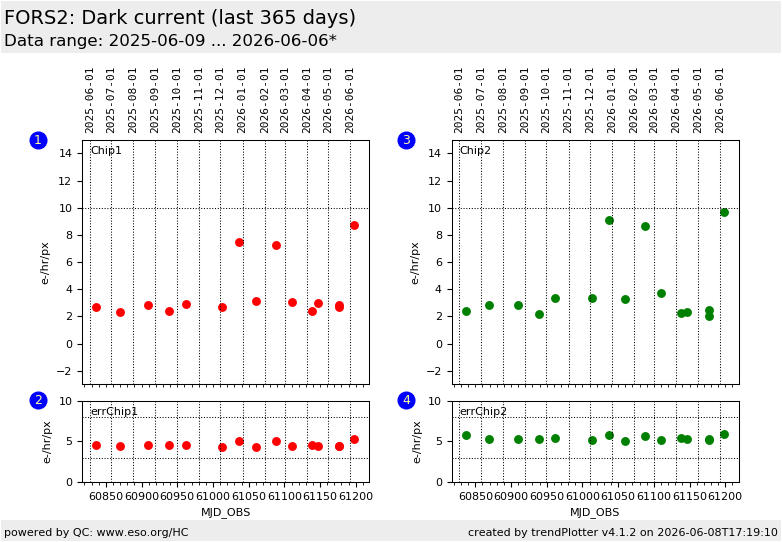
dark level of Chip1, high gain |
| 2 |
• | QC1DB |
none |
|
e-/hr/px |
VAL | 3,8 |
16 |
sigma_dark_avg |
this |
last_yr |
all
|
error of dark level of Chip1, high gain |
| 3 |
• | QC1DB |
none |
|
e-/hr/px |
VAL | -3,10 |
16 |
dark_avg |
this |
last_yr |
all
|
dark level of Chip2, high gain |
| 4 |
• | QC1DB |
none |
|
e-/hr/px |
VAL | 3,8 |
16 |
sigma_dark_avg |
this |
last_yr |
all
|
error of dark level of Chip2, high gain |
| |
|
*Data sources: QC1DB: QC1 database; LOCAL: local data source
|
Plot 1
scores:  1| 1|
| | data source: | fors2_dark
(QC1 database) |
| dataset: | dark_avg | • |
| average: | none |
| fixed thresholds: | -3...10 | e-/hr/px |
| N_data plotted: | 16 |
| [click plot for closeup] |
Plot 2
scores: 1|
| | data source: | fors2_dark
(QC1 database) |
| dataset: | sigma_dark_avg | • |
| average: | none |
| fixed thresholds: | 3...8 | e-/hr/px |
| N_data plotted: | 16 |
| [click plot for closeup] |
Plot 3
scores: 1|
| | data source: | fors2_dark
(QC1 database) |
| dataset: | dark_avg | • |
| average: | none |
| fixed thresholds: | -3...10 | e-/hr/px |
| N_data plotted: | 16 |
| [click plot for closeup] |
Plot 4
scores: 1|
| | data source: | fors2_dark
(QC1 database) |
| dataset: | sigma_dark_avg | • |
| average: | none |
| fixed thresholds: | 3...8 | e-/hr/px |
| N_data plotted: | 16 |
| [click plot for closeup] |
Dark frames are taken rarely with 2x2 bin, low and high gain. Those
with low gain usually have neglible dark current in ADU. The
typical exposure time is 1800 sec. The FORS pipeline generates master
DARKs from input raw DARKs with master BIAS subtracted.
Dark current: is computed from the median master dark frame level
in ADU/hr/px and transformed into electrons by using the conversion
factor CONAD. More information can be found on
the plot tutorial page
DB Name: fors2_dark
TPL.ID: img_cal_dark
Fits header keyword: NA, parameters calculated by QC script
QC1 DB parameter: dark_avg, sigma_dark_avg
General information
Click on any of the plots to see a close-up version.
The latest date is indicated on top of the plot.
If configured,
- data points belonging to the latest date are specially marked
- statistical averages are indicated by a solid line, and thresholds by broken lines
- outliers are marked by a red asterisk. They are defined as data points outside the
threshold lines
- "aliens" (= data points outside the plot Y limits) are marked by a red arrow (↑ or ↓)
- you can download the data for each parameter set if the 'Data downloads' link shows up
|
