Plot
? |
Symb
? |
Source
* |
Average ? |
Thresholds ? |
N_
data |
QC1
parameter |
Data
downloads |
Remarks |
| method |
value |
unit |
method |
value |
| 1 |
• | QC1DB |
none |
|
|
none | |
45 |
num_BP_UL |
this |
last_yr |
all
|
S13, J,H,Ks |
| 1 |
• | QC1DB |
none |
|
|
none | |
10 |
num_BP_UL |
this |
last_yr |
all
|
S27, J,H,Ks |
| 1 |
• | QC1DB |
none |
|
|
none | |
5 |
num_BP_UL |
this |
last_yr |
all
|
S54, J,H,Ks |
| 2 |
• | QC1DB |
none |
|
|
none | |
46 |
num_BP_UR |
this |
last_yr |
all
|
S13, J,H,Ks |
| 2 |
• | QC1DB |
none |
|
|
none | |
9 |
num_BP_UR |
this |
last_yr |
all
|
S27, J,H,Ks |
| 2 |
• | QC1DB |
none |
|
|
none | |
5 |
num_BP_UR |
this |
last_yr |
all
|
S54, J,H,Ks |
| 3 |
• | QC1DB |
none |
|
|
none | |
45 |
num_BP_LL |
this |
last_yr |
all
|
S13, J,H,Ks |
| 3 |
• | QC1DB |
none |
|
|
none | |
11 |
num_BP_LL |
this |
last_yr |
all
|
S27, J,H,Ks |
| 3 |
• | QC1DB |
none |
|
|
none | |
5 |
num_BP_LL |
this |
last_yr |
all
|
S54, J,H,Ks |
| 4 |
• | QC1DB |
none |
|
|
none | |
49 |
num_BP_LR |
this |
last_yr |
all
|
S13, J,H,Ks |
| 4 |
• | QC1DB |
none |
|
|
none | |
11 |
num_BP_LR |
this |
last_yr |
all
|
S27, J,H,Ks |
| 4 |
• | QC1DB |
none |
|
|
none | |
5 |
num_BP_LR |
this |
last_yr |
all
|
S54, J,H,Ks |
| |
|
*Data sources: QC1DB: QC1 database; LOCAL: local data source
|
Plot 1
scores: not implemented
| | data source: | naco_twflat
(QC1 database) |
dataset:
(numbers below apply to this dataset) | num_BP_UL | • |
| average: | none |
| thresholds: | none |
| N_data plotted: | 45 |
| [click plot for closeup] |
Plot 2
scores: not implemented
| | data source: | naco_twflat
(QC1 database) |
dataset:
(numbers below apply to this dataset) | num_BP_UR | • |
| average: | none |
| thresholds: | none |
| N_data plotted: | 46 |
| [click plot for closeup] |
Plot 3
scores: not implemented
| | data source: | naco_twflat
(QC1 database) |
dataset:
(numbers below apply to this dataset) | num_BP_LL | • |
| average: | none |
| thresholds: | none |
| N_data plotted: | 45 |
| [click plot for closeup] |
Plot 4
scores: not implemented
| | data source: | naco_twflat
(QC1 database) |
dataset:
(numbers below apply to this dataset) | num_BP_LR | • |
| average: | none |
| thresholds: | none |
| N_data plotted: | 49 |
| [click plot for closeup] |
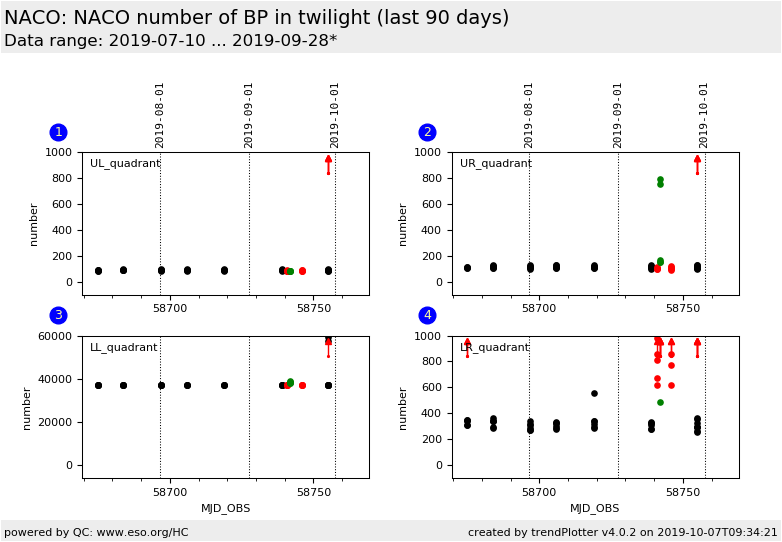
This plot shows the number of bad pixel in the twilight flat product in
dedicated areas. The areas are the four detector quadrants (512x512
pixel) but with about 100 pixel stripped off at all four edges resulting in an
analysis region of 312x312 pixel.
The high number of bad pixel in the LL quadrant since 2016 arises from
the dead columns of the detector. In the third quarter of 2015, the UR
detector quadrant was subject of dead columns.
This parameter is sensitive to erratic light contaminations.
General information
Click on any of the plots to see a close-up version.
The latest date is indicated on top of the plot.
If configured,
- data points belonging to the latest date are specially marked
- statistical averages are indicated by a solid line, and thresholds by broken lines
- outliers are marked by a red asterisk. They are defined as data points outside the
threshold lines
- "aliens" (= data points outside the plot Y limits) are marked by a red arrow (↑ or ↓)
- you can download the data for each parameter set if the 'Data downloads' link shows up
|
